
|
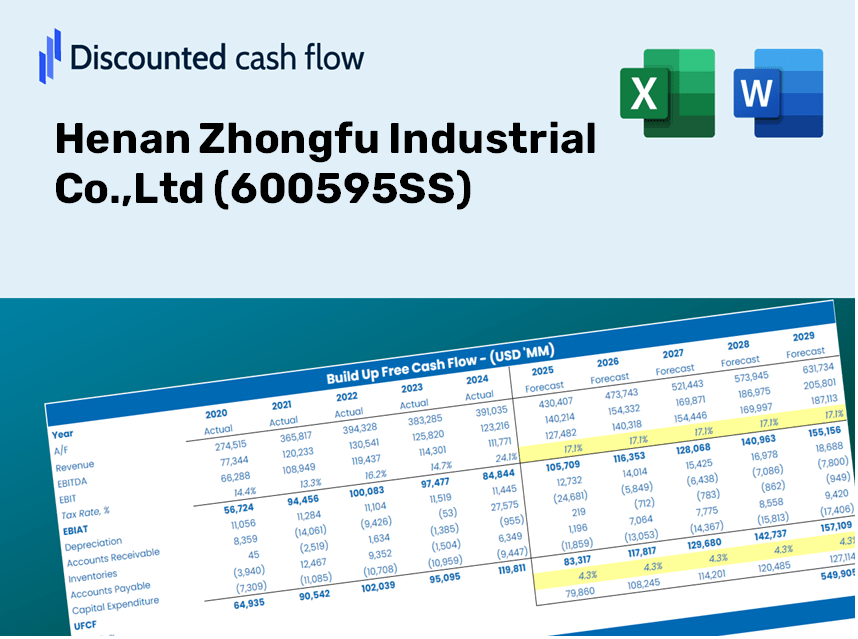
Henan Zhongfu Industrial Co., Ltd (600595.Sss) DCF -Bewertung |
Fully Editable: Tailor To Your Needs In Excel Or Sheets
Professional Design: Trusted, Industry-Standard Templates
Investor-Approved Valuation Models
MAC/PC Compatible, Fully Unlocked
No Expertise Is Needed; Easy To Follow
Henan Zhongfu Industrial Co.,Ltd (600595.SS) Bundle
Entdecken Sie die finanzielle Zukunft von Henan Zhongfu Industrial Co., Ltd, mit unserem benutzerfreundlichen DCF-Taschenrechner! Geben Sie Ihre Prognosen für Wachstum, Margen und Kosten ein, um den inneren Wert von Henan Zhongfu Industrial Co., Ltd (600595S) zu berechnen, und verfeinern Sie Ihren Investitionsansatz.
Discounted Cash Flow (DCF) - (USD MM)
| Year | AY1 2020 |
AY2 2021 |
AY3 2022 |
AY4 2023 |
AY5 2024 |
FY1 2025 |
FY2 2026 |
FY3 2027 |
FY4 2028 |
FY5 2029 |
|---|---|---|---|---|---|---|---|---|---|---|
| Revenue | 8,180.4 | 15,283.4 | 17,516.7 | 18,792.9 | 22,761.3 | 30,149.8 | 39,936.7 | 52,900.5 | 70,072.5 | 92,818.7 |
| Revenue Growth, % | 0 | 86.83 | 14.61 | 7.29 | 21.12 | 32.46 | 32.46 | 32.46 | 32.46 | 32.46 |
| EBITDA | 1,090.5 | 2,767.7 | 2,610.7 | 3,013.2 | 2,109.1 | 4,320.1 | 5,722.4 | 7,579.9 | 10,040.5 | 13,299.7 |
| EBITDA, % | 13.33 | 18.11 | 14.9 | 16.03 | 9.27 | 14.33 | 14.33 | 14.33 | 14.33 | 14.33 |
| Depreciation | 748.1 | 735.5 | 752.1 | 847.0 | 874.7 | 1,604.0 | 2,124.7 | 2,814.4 | 3,728.0 | 4,938.1 |
| Depreciation, % | 9.14 | 4.81 | 4.29 | 4.51 | 3.84 | 5.32 | 5.32 | 5.32 | 5.32 | 5.32 |
| EBIT | 342.4 | 2,032.2 | 1,858.5 | 2,166.2 | 1,234.3 | 2,716.0 | 3,597.7 | 4,765.5 | 6,312.5 | 8,361.6 |
| EBIT, % | 4.19 | 13.3 | 10.61 | 11.53 | 5.42 | 9.01 | 9.01 | 9.01 | 9.01 | 9.01 |
| Total Cash | 931.5 | 2,244.7 | 2,110.7 | 915.3 | 1,115.7 | 2,888.1 | 3,825.6 | 5,067.4 | 6,712.3 | 8,891.1 |
| Total Cash, percent | .0 | .0 | .0 | .0 | .0 | .0 | .0 | .0 | .0 | .0 |
| Account Receivables | 560.6 | 1,190.6 | 962.1 | 1,258.6 | 2,279.5 | 2,221.9 | 2,943.1 | 3,898.5 | 5,164.0 | 6,840.3 |
| Account Receivables, % | 6.85 | 7.79 | 5.49 | 6.7 | 10.01 | 7.37 | 7.37 | 7.37 | 7.37 | 7.37 |
| Inventories | 1,394.7 | 1,834.6 | 2,193.3 | 2,367.1 | 2,459.4 | 3,918.0 | 5,189.8 | 6,874.5 | 9,106.0 | 12,061.9 |
| Inventories, % | 17.05 | 12 | 12.52 | 12.6 | 10.81 | 13 | 13 | 13 | 13 | 13 |
| Accounts Payable | 386.8 | 2,660.4 | 3,394.9 | 885.6 | 2,542.5 | 3,461.1 | 4,584.6 | 6,072.8 | 8,044.1 | 10,655.3 |
| Accounts Payable, % | 4.73 | 17.41 | 19.38 | 4.71 | 11.17 | 11.48 | 11.48 | 11.48 | 11.48 | 11.48 |
| Capital Expenditure | -416.3 | -67.4 | -397.2 | -625.4 | -562.9 | -819.9 | -1,086.1 | -1,438.7 | -1,905.7 | -2,524.3 |
| Capital Expenditure, % | -5.09 | -0.44079 | -2.27 | -3.33 | -2.47 | -2.72 | -2.72 | -2.72 | -2.72 | -2.72 |
| Tax Rate, % | 22.07 | 22.07 | 22.07 | 22.07 | 22.07 | 22.07 | 22.07 | 22.07 | 22.07 | 22.07 |
| EBITAT | 355.9 | 1,739.7 | 1,579.5 | 1,350.5 | 961.9 | 2,231.9 | 2,956.3 | 3,916.0 | 5,187.2 | 6,871.0 |
| Depreciation | ||||||||||
| Changes in Account Receivables | ||||||||||
| Changes in Inventories | ||||||||||
| Changes in Accounts Payable | ||||||||||
| Capital Expenditure | ||||||||||
| UFCF | -880.8 | 3,611.4 | 2,538.7 | -1,407.5 | 1,817.5 | 2,533.6 | 3,125.4 | 4,139.9 | 5,483.8 | 7,263.9 |
| WACC, % | 8.01 | 7.79 | 7.78 | 7.43 | 7.67 | 7.73 | 7.73 | 7.73 | 7.73 | 7.73 |
| PV UFCF | ||||||||||
| SUM PV UFCF | 17,430.6 | |||||||||
| Long Term Growth Rate, % | 2.00 | |||||||||
| Free cash flow (T + 1) | 7,409 | |||||||||
| Terminal Value | 129,200 | |||||||||
| Present Terminal Value | 89,020 | |||||||||
| Enterprise Value | 106,451 | |||||||||
| Net Debt | 335 | |||||||||
| Equity Value | 106,116 | |||||||||
| Diluted Shares Outstanding, MM | 3,909 | |||||||||
| Equity Value Per Share | 27.14 |
What You Will Receive
- Authentic HENAN ZHONGFU Financial Data: Pre-loaded with historical and projected figures for accurate evaluation.
- Fully Customizable Template: Effortlessly adjust key parameters such as revenue growth, WACC, and EBITDA percentage.
- Real-Time Calculations: Watch the intrinsic value of HENAN ZHONGFU update instantly in response to your modifications.
- Professional Valuation Tool: Tailored for investors, analysts, and consultants in need of precise DCF analysis.
- User-Friendly Interface: Intuitive layout and straightforward guidelines suitable for all skill levels.
Key Features
- Customizable Forecast Inputs: Adjust essential factors such as revenue growth, EBITDA percentage, and capital expenditures to fit your analysis.
- Instant DCF Valuation: Provides immediate calculations of intrinsic value, NPV, and other important metrics.
- High-Precision Accuracy: Leverages Henan Zhongfu's (600595SS) real-world financial data for reliable valuation results.
- Simplified Scenario Analysis: Easily explore different scenarios and assess their impacts with straightforward comparisons.
- Efficiency Booster: Remove the hassle of constructing intricate valuation models from the ground up.
How It Functions
- Step 1: Download the pre-built Excel template featuring Henan Zhongfu Industrial Co., Ltd's data.
- Step 2: Review the filled sheets to familiarize yourself with the essential metrics.
- Step 3: Adjust forecasts and assumptions in the editable yellow cells (WACC, growth, margins).
- Step 4: Immediately see the updated results, including the intrinsic value of Henan Zhongfu Industrial Co., Ltd (600595SS).
- Step 5: Make well-informed investment choices or create reports based on the generated outputs.
Why Opt for This Calculator?
- Designed for Experts: A sophisticated tool tailored for analysts, CFOs, and industry consultants.
- Accurate Data: Henan Zhongfu Industrial Co., Ltd’s historical and projected financials preloaded for precision.
- Flexible Scenario Analysis: Effortlessly model various forecasts and assumptions.
- Clear Results: Instantly computes intrinsic value, NPV, and essential metrics.
- User-Friendly: Comprehensive step-by-step instructions lead you through the entire process.
Who Can Benefit from Our Product?
- Finance Students: Understand financial modeling and apply your knowledge with real industry data.
- Academics: Integrate advanced valuation methods into your research or educational programs.
- Investors: Validate your investment strategies by evaluating outcomes for Henan Zhongfu Industrial Co.,Ltd (600595SS).
- Analysts: Enhance your analytical efficiency with a customizable DCF model tailored for your needs.
- Small Business Owners: Discover how large public firms like Henan Zhongfu Industrial Co.,Ltd (600595SS) are assessed and valued.
Overview of Template Components
- Pre-Filled DCF Model: Financial data for Henan Zhongfu Industrial Co., Ltd (600595SS) preloaded for immediate analysis.
- WACC Calculator: Comprehensive calculations for the Weighted Average Cost of Capital.
- Financial Ratios: Assess Henan Zhongfu's profitability, leverage, and operational efficiency.
- Editable Inputs: Adjust assumptions like growth rates, profit margins, and capital expenditures to suit your analysis.
- Financial Statements: Access to annual and quarterly reports for in-depth evaluation.
- Interactive Dashboard: Effortlessly visualize essential valuation metrics and outcomes.
Disclaimer
All information, articles, and product details provided on this website are for general informational and educational purposes only. We do not claim any ownership over, nor do we intend to infringe upon, any trademarks, copyrights, logos, brand names, or other intellectual property mentioned or depicted on this site. Such intellectual property remains the property of its respective owners, and any references here are made solely for identification or informational purposes, without implying any affiliation, endorsement, or partnership.
We make no representations or warranties, express or implied, regarding the accuracy, completeness, or suitability of any content or products presented. Nothing on this website should be construed as legal, tax, investment, financial, medical, or other professional advice. In addition, no part of this site—including articles or product references—constitutes a solicitation, recommendation, endorsement, advertisement, or offer to buy or sell any securities, franchises, or other financial instruments, particularly in jurisdictions where such activity would be unlawful.
All content is of a general nature and may not address the specific circumstances of any individual or entity. It is not a substitute for professional advice or services. Any actions you take based on the information provided here are strictly at your own risk. You accept full responsibility for any decisions or outcomes arising from your use of this website and agree to release us from any liability in connection with your use of, or reliance upon, the content or products found herein.