
|
Helle Milchprodukte & Food Co., Ltd (600597.SS) DCF -Bewertung |
Fully Editable: Tailor To Your Needs In Excel Or Sheets
Professional Design: Trusted, Industry-Standard Templates
Investor-Approved Valuation Models
MAC/PC Compatible, Fully Unlocked
No Expertise Is Needed; Easy To Follow
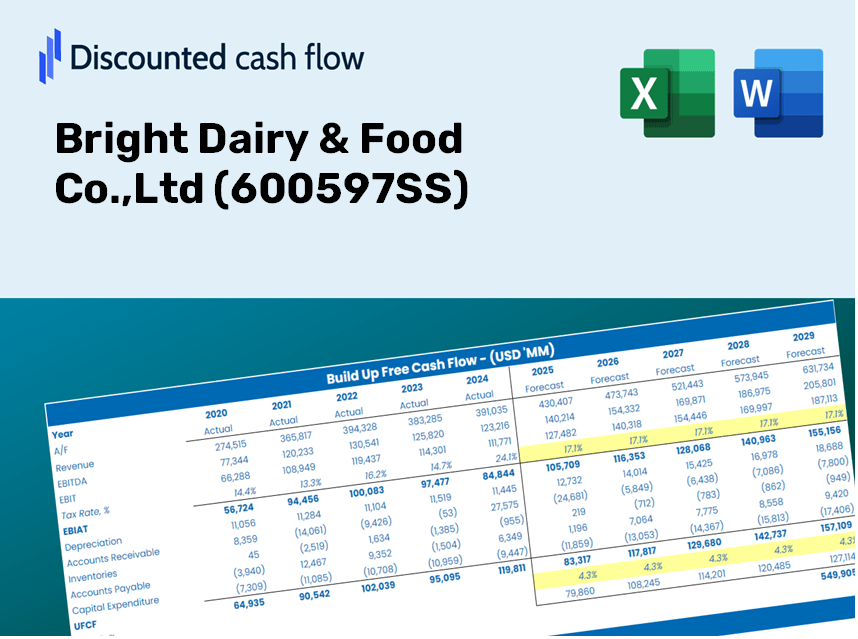
Bright Dairy & Food Co.,Ltd (600597.SS) Bundle
Bewerten Sie helle Milchprodukte & Food Co., Ltds finanzielle Zukunft wie ein Experte! Dieser DCF-Taschenrechner (600597) enthält vorgefüllte Finanzdaten und ermöglicht es Ihnen, das Umsatzwachstum, WACC, Margen und andere wesentliche Annahmen vollständig anzupassen, um sich an Ihren Projektionen anzupassen.
Benefits You Will Receive
- Comprehensive Financial Model: Leverage Bright Dairy & Food Co., Ltd's actual data for accurate DCF valuation.
- Complete Forecasting Authority: Modify revenue growth, profit margins, WACC, and other essential metrics.
- Real-Time Calculations: Instantaneous updates allow you to view results as alterations occur.
- Professional-Grade Template: A polished Excel format crafted for high-quality valuation presentations.
- Flexible and Reusable: Designed for adaptability, facilitating multiple uses for in-depth forecasts.
Key Features
- Accurate Bright Dairy Financials: Gain access to reliable pre-loaded historical data and future projections for Bright Dairy & Food Co., Ltd (600597SS).
- Customizable Forecast Assumptions: Modify yellow-highlighted fields such as WACC, growth rates, and profit margins according to your analysis.
- Dynamic Calculations: Enjoy automatic updates to DCF, Net Present Value (NPV), and cash flow assessments.
- Visual Dashboard: Utilize easy-to-understand charts and summaries that clearly present your valuation results.
- Designed for All Users: A straightforward, intuitive layout tailored for investors, CFOs, and consultants alike.
How It Works
- Step 1: Download the Excel file.
- Step 2: Review Bright Dairy & Food Co., Ltd’s pre-filled financial data and forecasts.
- Step 3: Modify key inputs such as revenue growth, WACC, and tax rates (highlighted cells).
- Step 4: Watch the DCF model update in real-time as you adjust your assumptions.
- Step 5: Analyze the outputs and leverage the results for your investment decisions.
Why Choose Bright Dairy & Food Co., Ltd (600597SS) Calculator?
- Save Time: Skip the hassle of building a DCF model from the ground up – it’s fully prepared for your use.
- Enhance Accuracy: Dependable financial data and formulas minimize valuation errors.
- Completely Customizable: Adjust the model to align with your unique assumptions and projections.
- User-Friendly: Intuitive charts and outputs ensure the results are straightforward to interpret.
- Endorsed by Professionals: Crafted for experts who prioritize both precision and ease of use.
Who Should Use This Product?
- Individual Investors: Gain insights to make informed decisions about buying or selling Bright Dairy & Food Co., Ltd (600597SS) stock.
- Financial Analysts: Enhance your valuation methodologies with comprehensive financial models tailored for Bright Dairy & Food Co., Ltd (600597SS).
- Consultants: Provide clients with precise and timely valuation insights regarding Bright Dairy & Food Co., Ltd (600597SS).
- Business Owners: Learn how major companies like Bright Dairy & Food Co., Ltd (600597SS) are valued to inform your own business strategies.
- Finance Students: Explore valuation techniques through practical applications using real data from Bright Dairy & Food Co., Ltd (600597SS).
Contents of the Template
- Preloaded Bright Dairy Data: Historical and projected financial metrics, including revenue, EBIT, and capital expenditures.
- DCF and WACC Models: Advanced spreadsheets designed for calculating intrinsic value and the Weighted Average Cost of Capital.
- Editable Inputs: Cells highlighted in yellow for modifying revenue growth, tax rates, and discount rates.
- Financial Statements: Detailed annual and quarterly financial reports for in-depth analysis.
- Key Ratios: Metrics on profitability, leverage, and efficiency for performance assessment.
- Dashboard and Charts: Visual representations of valuation results and underlying assumptions.
Disclaimer
All information, articles, and product details provided on this website are for general informational and educational purposes only. We do not claim any ownership over, nor do we intend to infringe upon, any trademarks, copyrights, logos, brand names, or other intellectual property mentioned or depicted on this site. Such intellectual property remains the property of its respective owners, and any references here are made solely for identification or informational purposes, without implying any affiliation, endorsement, or partnership.
We make no representations or warranties, express or implied, regarding the accuracy, completeness, or suitability of any content or products presented. Nothing on this website should be construed as legal, tax, investment, financial, medical, or other professional advice. In addition, no part of this site—including articles or product references—constitutes a solicitation, recommendation, endorsement, advertisement, or offer to buy or sell any securities, franchises, or other financial instruments, particularly in jurisdictions where such activity would be unlawful.
All content is of a general nature and may not address the specific circumstances of any individual or entity. It is not a substitute for professional advice or services. Any actions you take based on the information provided here are strictly at your own risk. You accept full responsibility for any decisions or outcomes arising from your use of this website and agree to release us from any liability in connection with your use of, or reliance upon, the content or products found herein.