
|
Everbright Jiabao Co., Ltd. (600622.ss) DCF -Bewertung |
Fully Editable: Tailor To Your Needs In Excel Or Sheets
Professional Design: Trusted, Industry-Standard Templates
Investor-Approved Valuation Models
MAC/PC Compatible, Fully Unlocked
No Expertise Is Needed; Easy To Follow
Everbright Jiabao Co., Ltd. (600622.SS) Bundle
Vereinfachen Sie Everbright Jiabao Co., Ltd. (6006222S) Bewertung mit diesem anpassbaren DCF -Taschenrechner! Mit Real Everbright Jiabao Co., Ltd. (6006222S) Finanzdaten und einstellbaren Prognoseeingaben können Sie Szenarien testen und Everbright Jiabao Co., Ltd. (600622S) faire Wert innerhalb von Minuten aufdecken.
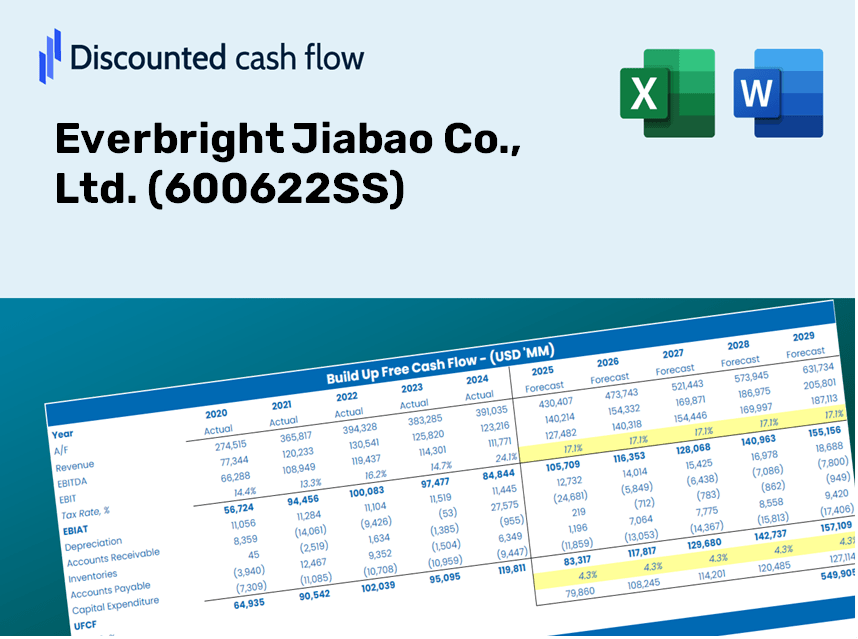
Discounted Cash Flow (DCF) - (USD MM)
| Year | AY1 2020 |
AY2 2021 |
AY3 2022 |
AY4 2023 |
AY5 2024 |
FY1 2025 |
FY2 2026 |
FY3 2027 |
FY4 2028 |
FY5 2029 |
|---|---|---|---|---|---|---|---|---|---|---|
| Revenue | 3,937.4 | 4,094.6 | 5,569.8 | 4,390.1 | 1,817.7 | 1,921.5 | 2,031.1 | 2,147.0 | 2,269.5 | 2,399.0 |
| Revenue Growth, % | 0 | 3.99 | 36.03 | -21.18 | -58.59 | 5.71 | 5.71 | 5.71 | 5.71 | 5.71 |
| EBITDA | 1,370.7 | 1,428.4 | 1,078.3 | -1,153.1 | -799.3 | 72.3 | 76.4 | 80.8 | 85.4 | 90.3 |
| EBITDA, % | 34.81 | 34.88 | 19.36 | -26.27 | -43.97 | 3.76 | 3.76 | 3.76 | 3.76 | 3.76 |
| Depreciation | 26.4 | 413.5 | 388.1 | 45.0 | 33.0 | 79.1 | 83.6 | 88.4 | 93.4 | 98.7 |
| Depreciation, % | 0.67111 | 10.1 | 6.97 | 1.03 | 1.82 | 4.12 | 4.12 | 4.12 | 4.12 | 4.12 |
| EBIT | 1,344.3 | 1,014.8 | 690.2 | -1,198.1 | -832.4 | -6.8 | -7.2 | -7.6 | -8.0 | -8.5 |
| EBIT, % | 34.14 | 24.78 | 12.39 | -27.29 | -45.79 | -0.35297 | -0.35297 | -0.35297 | -0.35297 | -0.35297 |
| Total Cash | 3,924.8 | 4,657.1 | 2,927.3 | 2,624.4 | 2,105.4 | 1,583.3 | 1,673.7 | 1,769.2 | 1,870.1 | 1,976.8 |
| Total Cash, percent | .0 | .0 | .0 | .0 | .0 | .0 | .0 | .0 | .0 | .0 |
| Account Receivables | 1,237.9 | 421.4 | 559.1 | 1,248.2 | 977.1 | 514.8 | 544.2 | 575.2 | 608.0 | 642.7 |
| Account Receivables, % | 31.44 | 10.29 | 10.04 | 28.43 | 53.75 | 26.79 | 26.79 | 26.79 | 26.79 | 26.79 |
| Inventories | 8,996.3 | 6,670.6 | 3,909.6 | 1,804.5 | 1,166.5 | 1,442.9 | 1,525.2 | 1,612.3 | 1,704.3 | 1,801.5 |
| Inventories, % | 228.49 | 162.91 | 70.19 | 41.1 | 64.18 | 75.09 | 75.09 | 75.09 | 75.09 | 75.09 |
| Accounts Payable | 769.1 | 1,089.3 | 1,057.0 | 823.7 | 350.7 | 396.5 | 419.1 | 443.0 | 468.3 | 495.0 |
| Accounts Payable, % | 19.53 | 26.6 | 18.98 | 18.76 | 19.29 | 20.63 | 20.63 | 20.63 | 20.63 | 20.63 |
| Capital Expenditure | -624.6 | -441.4 | -168.0 | -84.5 | -115.9 | -145.9 | -154.2 | -163.0 | -172.3 | -182.1 |
| Capital Expenditure, % | -15.86 | -10.78 | -3.02 | -1.93 | -6.38 | -7.59 | -7.59 | -7.59 | -7.59 | -7.59 |
| Tax Rate, % | -2.45 | -2.45 | -2.45 | -2.45 | -2.45 | -2.45 | -2.45 | -2.45 | -2.45 | -2.45 |
| EBITAT | 855.1 | 487.1 | 129.3 | -1,267.9 | -852.8 | -4.5 | -4.7 | -5.0 | -5.3 | -5.6 |
| Depreciation | ||||||||||
| Changes in Account Receivables | ||||||||||
| Changes in Inventories | ||||||||||
| Changes in Accounts Payable | ||||||||||
| Capital Expenditure | ||||||||||
| UFCF | -9,208.1 | 3,921.5 | 2,940.6 | -124.7 | -499.6 | 160.5 | -164.4 | -173.8 | -183.7 | -194.2 |
| WACC, % | 4.8 | 4.14 | 2.91 | 6.33 | 6.33 | 4.9 | 4.9 | 4.9 | 4.9 | 4.9 |
| PV UFCF | ||||||||||
| SUM PV UFCF | -451.6 | |||||||||
| Long Term Growth Rate, % | 1.00 | |||||||||
| Free cash flow (T + 1) | -196 | |||||||||
| Terminal Value | -5,027 | |||||||||
| Present Terminal Value | -3,957 | |||||||||
| Enterprise Value | -4,409 | |||||||||
| Net Debt | 6,673 | |||||||||
| Equity Value | -11,082 | |||||||||
| Diluted Shares Outstanding, MM | 1,499 | |||||||||
| Equity Value Per Share | -7.39 |
Benefits You Will Receive
- Authentic Everbright Jiabao Data: Comprehensive financial information – from revenue to EBIT – grounded in actual and anticipated figures.
- Complete Customization: Modify all essential parameters (yellow cells) such as WACC, growth %, and tax rates.
- Immediate Valuation Updates: Automatic recalculations to evaluate the effects of adjustments on Everbright Jiabao’s fair value.
- Flexible Excel Template: Designed for easy modifications, scenario analysis, and in-depth projections.
- Time-Efficient and Precise: Avoid building models from the ground up while ensuring accuracy and adaptability.
Key Features
- Pre-Loaded Data: Everbright Jiabao Co., Ltd. (600622SS) historical financial statements and pre-filled forecasts.
- Fully Adjustable Inputs: Customize WACC, tax rates, revenue growth, and EBITDA margins to fit your analysis.
- Instant Results: Watch the intrinsic value of Everbright Jiabao Co., Ltd. (600622SS) recalibrate in real time.
- Clear Visual Outputs: Interactive dashboard charts showcase valuation results and essential metrics.
- Built for Accuracy: A reliable tool designed for analysts, investors, and finance professionals.
How It Operates
- Step 1: Download the prebuilt Excel template featuring Everbright Jiabao Co., Ltd.’s (600622SS) data.
- Step 2: Review the pre-filled sheets to familiarize yourself with the key performance indicators.
- Step 3: Modify your forecasts and assumptions in the editable yellow cells (WACC, growth, margins).
- Step 4: Instantly see updated results, including the intrinsic value of Everbright Jiabao Co., Ltd. (600622SS).
- Step 5: Use the outputs to make informed investment decisions or create comprehensive reports.
Why Choose the Everbright Jiabao Calculator?
- Designed for Experts: A sophisticated tool tailored for analysts, CFOs, and consultants in the industry.
- Accurate Data Integration: Everbright Jiabao’s historical and projected financial data is preloaded for precision.
- Flexible Scenario Analysis: Effortlessly test various forecasts and assumptions.
- Comprehensive Outputs: Instantly computes intrinsic value, NPV, and essential financial metrics.
- User-Friendly Interface: Detailed, step-by-step instructions make the process seamless.
Who Can Benefit from This Product?
- Investors: Accurately assess the fair value of Everbright Jiabao Co., Ltd. (600622SS) before making investment choices.
- Chief Financial Officers (CFOs): Utilize a professional-grade DCF model for precise financial reporting and analysis.
- Consultants: Efficiently customize the template for valuation reports tailored to client needs.
- Entrepreneurs: Acquire insights into financial modeling practices applied by leading corporations.
- Educators: Employ it as an instructional resource to illustrate valuation techniques.
What This Template Includes
- Preloaded 600622SS Data: Historical and projected financial information, covering revenue, EBIT, and capital expenditures.
- DCF and WACC Models: High-quality sheets designed for calculating intrinsic value and Weighted Average Cost of Capital.
- Editable Inputs: Cells highlighted in yellow for modifying revenue growth, tax rates, and discount rates.
- Financial Statements: Detailed annual and quarterly financials for thorough analysis.
- Key Ratios: Metrics for profitability, leverage, and efficiency to assess performance.
- Dashboard and Charts: Visual representations of valuation results and key assumptions.
Disclaimer
All information, articles, and product details provided on this website are for general informational and educational purposes only. We do not claim any ownership over, nor do we intend to infringe upon, any trademarks, copyrights, logos, brand names, or other intellectual property mentioned or depicted on this site. Such intellectual property remains the property of its respective owners, and any references here are made solely for identification or informational purposes, without implying any affiliation, endorsement, or partnership.
We make no representations or warranties, express or implied, regarding the accuracy, completeness, or suitability of any content or products presented. Nothing on this website should be construed as legal, tax, investment, financial, medical, or other professional advice. In addition, no part of this site—including articles or product references—constitutes a solicitation, recommendation, endorsement, advertisement, or offer to buy or sell any securities, franchises, or other financial instruments, particularly in jurisdictions where such activity would be unlawful.
All content is of a general nature and may not address the specific circumstances of any individual or entity. It is not a substitute for professional advice or services. Any actions you take based on the information provided here are strictly at your own risk. You accept full responsibility for any decisions or outcomes arising from your use of this website and agree to release us from any liability in connection with your use of, or reliance upon, the content or products found herein.