
|
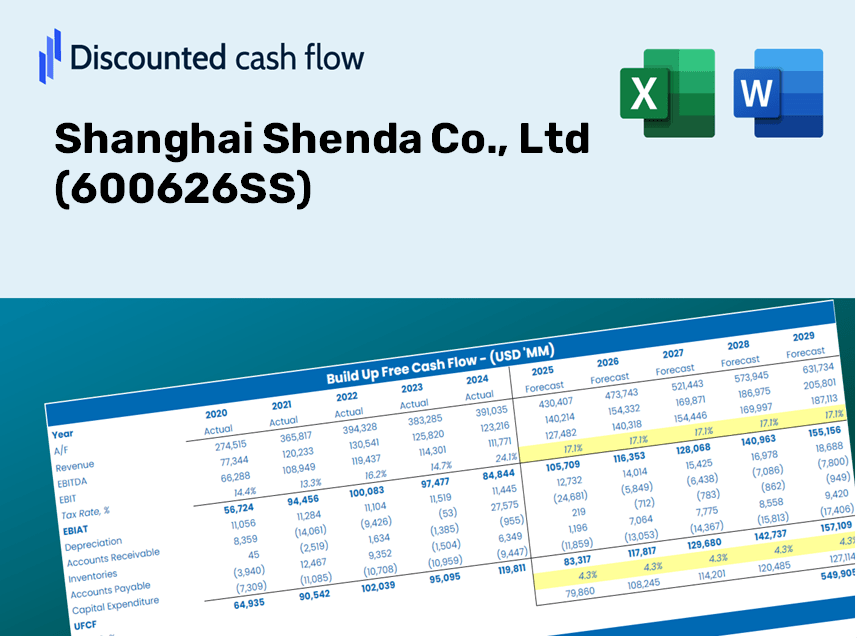
Shanghai Shenda Co., Ltd (600626.SS) DCF -Bewertung |
Fully Editable: Tailor To Your Needs In Excel Or Sheets
Professional Design: Trusted, Industry-Standard Templates
Investor-Approved Valuation Models
MAC/PC Compatible, Fully Unlocked
No Expertise Is Needed; Easy To Follow
Shanghai Shenda Co., Ltd (600626.SS) Bundle
Verbessern Sie Ihre Anlagestrategien mit dem DCF -Taschenrechner (600626S)! Erforschen Sie authentische Finanzdaten von Shanghai Shenda Co., Ltd., stellen Sie Wachstumsprojektionen und -kosten an und beobachten Sie sofort, wie sich diese Modifikationen auf den intrinsischen Wert von (600626SS) auswirken.
Discounted Cash Flow (DCF) - (USD MM)
| Year | AY1 2020 |
AY2 2021 |
AY3 2022 |
AY4 2023 |
AY5 2024 |
FY1 2025 |
FY2 2026 |
FY3 2027 |
FY4 2028 |
FY5 2029 |
|---|---|---|---|---|---|---|---|---|---|---|
| Revenue | 10,824.0 | 10,550.4 | 11,244.0 | 11,667.7 | 11,824.3 | 13,492.1 | 15,395.3 | 17,566.8 | 20,044.7 | 22,872.1 |
| Revenue Growth, % | 0 | -2.53 | 6.57 | 3.77 | 1.34 | 14.11 | 14.11 | 14.11 | 14.11 | 14.11 |
| EBITDA | -229.1 | 729.8 | 428.2 | 353.4 | 846.0 | 507.1 | 578.6 | 660.2 | 753.4 | 859.6 |
| EBITDA, % | -2.12 | 6.92 | 3.81 | 3.03 | 7.16 | 3.76 | 3.76 | 3.76 | 3.76 | 3.76 |
| Depreciation | 520.1 | 561.4 | 558.4 | 561.2 | 560.7 | 665.0 | 758.8 | 865.8 | 988.0 | 1,127.3 |
| Depreciation, % | 4.8 | 5.32 | 4.97 | 4.81 | 4.74 | 4.93 | 4.93 | 4.93 | 4.93 | 4.93 |
| EBIT | -749.2 | 168.4 | -130.3 | -207.8 | 285.4 | -157.9 | -180.2 | -205.6 | -234.6 | -267.7 |
| EBIT, % | -6.92 | 1.6 | -1.16 | -1.78 | 2.41 | -1.17 | -1.17 | -1.17 | -1.17 | -1.17 |
| Total Cash | 1,443.7 | 1,470.7 | 1,833.8 | 2,167.9 | 1,967.4 | 2,126.5 | 2,426.5 | 2,768.7 | 3,159.3 | 3,604.9 |
| Total Cash, percent | .0 | .0 | .0 | .0 | .0 | .0 | .0 | .0 | .0 | .0 |
| Account Receivables | 1,483.7 | 1,413.3 | 1,874.5 | 2,021.0 | 1,965.6 | 2,097.2 | 2,393.0 | 2,730.6 | 3,115.7 | 3,555.2 |
| Account Receivables, % | 13.71 | 13.4 | 16.67 | 17.32 | 16.62 | 15.54 | 15.54 | 15.54 | 15.54 | 15.54 |
| Inventories | 779.9 | 870.0 | 760.7 | 855.0 | 765.7 | 972.0 | 1,109.1 | 1,265.5 | 1,444.0 | 1,647.7 |
| Inventories, % | 7.2 | 8.25 | 6.77 | 7.33 | 6.48 | 7.2 | 7.2 | 7.2 | 7.2 | 7.2 |
| Accounts Payable | 1,286.4 | 1,374.6 | 2,062.3 | 1,891.8 | 1,790.2 | 2,013.2 | 2,297.2 | 2,621.2 | 2,991.0 | 3,412.9 |
| Accounts Payable, % | 11.88 | 13.03 | 18.34 | 16.21 | 15.14 | 14.92 | 14.92 | 14.92 | 14.92 | 14.92 |
| Capital Expenditure | -441.9 | -453.0 | -353.3 | -279.2 | -254.4 | -433.4 | -494.6 | -564.3 | -643.9 | -734.8 |
| Capital Expenditure, % | -4.08 | -4.29 | -3.14 | -2.39 | -2.15 | -3.21 | -3.21 | -3.21 | -3.21 | -3.21 |
| Tax Rate, % | 46.43 | 46.43 | 46.43 | 46.43 | 46.43 | 46.43 | 46.43 | 46.43 | 46.43 | 46.43 |
| EBITAT | -841.7 | -219.0 | -169.1 | -199.6 | 152.9 | -110.4 | -126.0 | -143.8 | -164.0 | -187.2 |
| Depreciation | ||||||||||
| Changes in Account Receivables | ||||||||||
| Changes in Inventories | ||||||||||
| Changes in Accounts Payable | ||||||||||
| Capital Expenditure | ||||||||||
| UFCF | -1,740.7 | -42.1 | 371.8 | -329.0 | 502.3 | 6.4 | -10.7 | -12.2 | -13.9 | -15.9 |
| WACC, % | 8.35 | 6.59 | 8.35 | 8.28 | 7.53 | 7.82 | 7.82 | 7.82 | 7.82 | 7.82 |
| PV UFCF | ||||||||||
| SUM PV UFCF | -34.3 | |||||||||
| Long Term Growth Rate, % | 2.00 | |||||||||
| Free cash flow (T + 1) | -16 | |||||||||
| Terminal Value | -279 | |||||||||
| Present Terminal Value | -191 | |||||||||
| Enterprise Value | -226 | |||||||||
| Net Debt | 1,297 | |||||||||
| Equity Value | -1,523 | |||||||||
| Diluted Shares Outstanding, MM | 1,320 | |||||||||
| Equity Value Per Share | -1.15 |
What You Will Receive
- Authentic Shanghai Shenda Data: Comprehensive financials – including revenue and EBIT – derived from actual and anticipated figures.
- Complete Customization: Modify all essential parameters (highlighted cells) such as WACC, growth rates, and tax percentages.
- Immediate Valuation Adjustments: Automatic updates to analyze the effects of changes on Shanghai Shenda's fair value.
- Flexible Excel Template: Designed for quick modifications, scenario analysis, and in-depth forecasting.
- Efficient and Precise: Avoid the hassle of creating models from the ground up while ensuring accuracy and adaptability.
Key Features
- Customizable Forecast Inputs: Adjust essential parameters such as revenue growth, EBITDA percentage, and capital expenditures for accurate projections.
- Instant DCF Valuation: Quickly computes intrinsic value, NPV, and additional financial metrics.
- High-Precision Accuracy: Leverages Shanghai Shenda Co., Ltd's real financial data for credible valuation results.
- Simple Scenario Analysis: Easily evaluate various assumptions and assess the impact on outcomes.
- Efficiency Booster: Avoid the hassle of constructing intricate valuation models from the ground up.
How It Works
- Step 1: Download the Excel file.
- Step 2: Examine the pre-filled data for Shanghai Shenda Co., Ltd (600626SS), including historical and forecasted information.
- Step 3: Modify the key assumptions (highlighted in yellow) according to your analysis.
- Step 4: Observe the automatic recalculations of intrinsic value for Shanghai Shenda Co., Ltd (600626SS).
- Step 5: Utilize the results for your investment strategies or reporting needs.
Why Choose This Calculator for Shanghai Shenda Co., Ltd (600626SS)?
- Accurate Data: Utilizes real financial figures for Shanghai Shenda to ensure dependable valuation outcomes.
- Customizable: Modify essential parameters such as growth rates, WACC, and tax rates to align with your specific forecasts.
- Time-Saving: Pre-configured calculations save you from having to start from the ground up.
- Professional-Grade Tool: Tailored for investors, analysts, and consultants focused on Shanghai Shenda.
- User-Friendly: Features an intuitive design and clear instructions, making it accessible to all users.
Who Can Benefit from Our Services?
- Finance Students: Master valuation methods and practice them with actual market data for Shanghai Shenda Co., Ltd (600626SS).
- Researchers: Integrate advanced analytical models into your studies or papers related to Shanghai Shenda Co., Ltd (600626SS).
- Investors: Validate your investment hypotheses and assess the market performance of Shanghai Shenda Co., Ltd (600626SS).
- Financial Analysts: Enhance your analysis process with our user-friendly, customizable DCF model tailored for Shanghai Shenda Co., Ltd (600626SS).
- Entrepreneurs: Discover how major corporations like Shanghai Shenda Co., Ltd (600626SS) are evaluated in the market.
Contents of the Template
- Operating and Balance Sheet Data: Pre-filled historical data and forecasts for Shanghai Shenda Co., Ltd (600626SS), including revenue, EBITDA, EBIT, and capital expenditures.
- WACC Calculation: A dedicated sheet for the Weighted Average Cost of Capital (WACC), featuring parameters such as Beta, risk-free rate, and share price.
- DCF Valuation (Unlevered and Levered): Editable Discounted Cash Flow models presenting intrinsic value with comprehensive calculations.
- Financial Statements: Pre-loaded financial statements (both annual and quarterly) to facilitate analysis.
- Key Ratios: Includes profitability, leverage, and efficiency ratios specific to Shanghai Shenda Co., Ltd (600626SS).
- Dashboard and Charts: A visual overview of valuation outputs and underlying assumptions for straightforward result analysis.
Disclaimer
All information, articles, and product details provided on this website are for general informational and educational purposes only. We do not claim any ownership over, nor do we intend to infringe upon, any trademarks, copyrights, logos, brand names, or other intellectual property mentioned or depicted on this site. Such intellectual property remains the property of its respective owners, and any references here are made solely for identification or informational purposes, without implying any affiliation, endorsement, or partnership.
We make no representations or warranties, express or implied, regarding the accuracy, completeness, or suitability of any content or products presented. Nothing on this website should be construed as legal, tax, investment, financial, medical, or other professional advice. In addition, no part of this site—including articles or product references—constitutes a solicitation, recommendation, endorsement, advertisement, or offer to buy or sell any securities, franchises, or other financial instruments, particularly in jurisdictions where such activity would be unlawful.
All content is of a general nature and may not address the specific circumstances of any individual or entity. It is not a substitute for professional advice or services. Any actions you take based on the information provided here are strictly at your own risk. You accept full responsibility for any decisions or outcomes arising from your use of this website and agree to release us from any liability in connection with your use of, or reliance upon, the content or products found herein.