
|
Shanghai Wanye Enterprises Co., Ltd (600641.SS) DCF -Bewertung |
Fully Editable: Tailor To Your Needs In Excel Or Sheets
Professional Design: Trusted, Industry-Standard Templates
Investor-Approved Valuation Models
MAC/PC Compatible, Fully Unlocked
No Expertise Is Needed; Easy To Follow
Shanghai Wanye Enterprises Co.,Ltd (600641.SS) Bundle
Gewinnen Sie einen Einblick in Ihre Shanghai Wanye Enterprises Co., Ltd (600641SS) Bewertungsanalyse mit unserem modernsten DCF-Taschenrechner! Diese Excel -Vorlage wird mit realen (600641S) Daten vorinstalliert, sodass Sie Prognosen und Annahmen für eine genaue Berechnung von Shanghai Wanye Enterprises Co., Ltd, anpassen können.
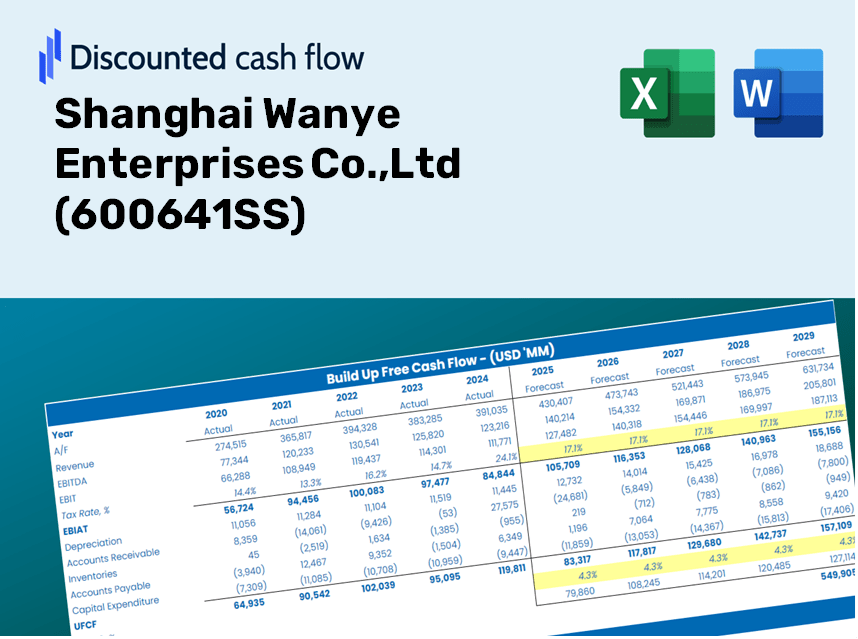
Discounted Cash Flow (DCF) - (USD MM)
| Year | AY1 2020 |
AY2 2021 |
AY3 2022 |
AY4 2023 |
AY5 2024 |
FY1 2025 |
FY2 2026 |
FY3 2027 |
FY4 2028 |
FY5 2029 |
|---|---|---|---|---|---|---|---|---|---|---|
| Revenue | 931.5 | 879.9 | 1,157.6 | 964.6 | 581.4 | 537.3 | 496.5 | 458.8 | 423.9 | 391.7 |
| Revenue Growth, % | 0 | -5.54 | 31.56 | -16.67 | -39.72 | -7.59 | -7.59 | -7.59 | -7.59 | -7.59 |
| EBITDA | 285.2 | 247.1 | 286.5 | 22.9 | -194.4 | 56.3 | 52.0 | 48.1 | 44.4 | 41.0 |
| EBITDA, % | 30.62 | 28.08 | 24.75 | 2.38 | -33.44 | 10.48 | 10.48 | 10.48 | 10.48 | 10.48 |
| Depreciation | 22.5 | 25.2 | 28.7 | 31.6 | 58.6 | 22.7 | 20.9 | 19.4 | 17.9 | 16.5 |
| Depreciation, % | 2.41 | 2.86 | 2.48 | 3.27 | 10.08 | 4.22 | 4.22 | 4.22 | 4.22 | 4.22 |
| EBIT | 262.7 | 221.9 | 257.8 | -8.6 | -253.0 | 33.6 | 31.1 | 28.7 | 26.5 | 24.5 |
| EBIT, % | 28.21 | 25.22 | 22.27 | -0.89472 | -43.51 | 6.26 | 6.26 | 6.26 | 6.26 | 6.26 |
| Total Cash | 2,969.9 | 4,243.2 | 4,076.6 | 3,730.0 | 3,681.4 | 537.3 | 496.5 | 458.8 | 423.9 | 391.7 |
| Total Cash, percent | .0 | .0 | .0 | .0 | .0 | .0 | .0 | .0 | .0 | .0 |
| Account Receivables | 45.1 | 548.7 | 69.4 | 169.9 | 148.4 | 125.0 | 115.5 | 106.7 | 98.6 | 91.1 |
| Account Receivables, % | 4.84 | 62.36 | 5.99 | 17.62 | 25.53 | 23.27 | 23.27 | 23.27 | 23.27 | 23.27 |
| Inventories | 778.0 | 706.1 | 900.4 | 1,102.6 | 1,392.8 | 474.5 | 438.4 | 405.1 | 374.4 | 346.0 |
| Inventories, % | 83.53 | 80.24 | 77.79 | 114.31 | 239.55 | 88.31 | 88.31 | 88.31 | 88.31 | 88.31 |
| Accounts Payable | 255.5 | 163.9 | 174.0 | 300.1 | 269.4 | 148.9 | 137.6 | 127.1 | 117.5 | 108.5 |
| Accounts Payable, % | 27.43 | 18.62 | 15.03 | 31.11 | 46.33 | 27.71 | 27.71 | 27.71 | 27.71 | 27.71 |
| Capital Expenditure | -18.0 | -108.1 | -174.7 | -693.5 | -91.3 | -125.6 | -116.1 | -107.3 | -99.1 | -91.6 |
| Capital Expenditure, % | -1.93 | -12.28 | -15.09 | -71.9 | -15.7 | -23.38 | -23.38 | -23.38 | -23.38 | -23.38 |
| Tax Rate, % | -171.89 | -171.89 | -171.89 | -171.89 | -171.89 | -171.89 | -171.89 | -171.89 | -171.89 | -171.89 |
| EBITAT | 198.9 | 168.1 | 212.5 | -7.7 | -687.9 | 28.5 | 26.3 | 24.3 | 22.5 | 20.7 |
| Depreciation | ||||||||||
| Changes in Account Receivables | ||||||||||
| Changes in Inventories | ||||||||||
| Changes in Accounts Payable | ||||||||||
| Capital Expenditure | ||||||||||
| UFCF | -364.2 | -438.1 | 361.6 | -846.3 | -1,020.0 | 746.8 | -34.6 | -32.0 | -29.6 | -27.3 |
| WACC, % | 5.38 | 5.38 | 5.39 | 5.4 | 5.41 | 5.39 | 5.39 | 5.39 | 5.39 | 5.39 |
| PV UFCF | ||||||||||
| SUM PV UFCF | 605.1 | |||||||||
| Long Term Growth Rate, % | 3.50 | |||||||||
| Free cash flow (T + 1) | -28 | |||||||||
| Terminal Value | -1,495 | |||||||||
| Present Terminal Value | -1,150 | |||||||||
| Enterprise Value | -545 | |||||||||
| Net Debt | -2,601 | |||||||||
| Equity Value | 2,056 | |||||||||
| Diluted Shares Outstanding, MM | 917 | |||||||||
| Equity Value Per Share | 2.24 |
Benefits You Will Receive
- Accurate Shanghai Wanye Financials: Provides both historical and projected data for precise valuation.
- Customizable Parameters: Adjust WACC, tax rates, revenue growth, and capital expenditures as needed.
- Instant Calculations: Intrinsic value and NPV are computed automatically.
- Scenario Testing: Analyze various scenarios to assess the future performance of Shanghai Wanye Enterprises (600641SS).
- User-Friendly Design: Tailored for professionals while remaining approachable for newcomers.
Key Features
- Authentic Financial Insights: Gain access to reliable pre-loaded historical data and future forecasts for Shanghai Wanye Enterprises Co., Ltd (600641SS).
- Tailorable Projection Variables: Modify the yellow-highlighted cells to adjust key metrics such as WACC, growth rates, and profit margins.
- Real-Time Calculations: Automatic adjustments to DCF, Net Present Value (NPV), and cash flow evaluations.
- Visual Analytics Dashboard: User-friendly charts and summaries designed to effectively present your valuation findings.
- Suitable for All Skill Levels: An intuitive layout crafted for investors, CFOs, and consultants, ensuring ease of use for both novices and experts.
How It Works
- Step 1: Download the Excel file.
- Step 2: Examine the pre-filled data for Shanghai Wanye Enterprises Co.,Ltd (600641SS) (historical and forecasted).
- Step 3: Modify key assumptions (highlighted in yellow) based on your analysis.
- Step 4: Observe the automatic recalculations reflecting the intrinsic value of Shanghai Wanye Enterprises Co.,Ltd (600641SS).
- Step 5: Utilize the results for making investment decisions or for reporting purposes.
Why Opt for This Calculator?
- Reliable Metrics: Utilize authentic financial data from Shanghai Wanye Enterprises Co., Ltd (600641SS) for trustworthy evaluation results.
- Tailored Experience: Modify essential factors such as growth projections, WACC, and tax rates to align with your forecasts.
- Efficiency Boost: Built-in calculations save you the time and effort of starting from square one.
- Expert-Grade Resource: Crafted for investors, analysts, and consultants seeking precision.
- Accessible Interface: A straightforward design and clear, step-by-step guidance ensure ease of use for everyone.
Who Should Consider This Product?
- Individual Investors: Gain insights to make educated decisions when trading shares of Shanghai Wanye Enterprises Co., Ltd (600641SS).
- Financial Analysts: Enhance your valuation processes with accessible financial models tailored for Shanghai Wanye Enterprises Co., Ltd (600641SS).
- Consultants: Provide your clients with accurate and timely valuation analysis related to Shanghai Wanye Enterprises Co., Ltd (600641SS).
- Business Owners: Learn how the valuation of major players like Shanghai Wanye Enterprises Co., Ltd (600641SS) can inform your own business strategy.
- Finance Students: Explore valuation methods using practical data and case studies centered around Shanghai Wanye Enterprises Co., Ltd (600641SS).
Contents of the Template
- Detailed DCF Model: Editable template featuring in-depth valuation calculations.
- Actual Financial Data: Shanghai Wanye Enterprises Co., Ltd's historical and projected financials preloaded for analysis.
- Adjustable Assumptions: Modify WACC, growth rates, and tax estimates to explore various scenarios.
- Comprehensive Financial Statements: Complete annual and quarterly reports for enhanced insights.
- Essential Ratios: Integrated analysis for profitability, efficiency, and leverage metrics.
- Visual Dashboard: Charts and tables providing clear, actionable results.
Disclaimer
All information, articles, and product details provided on this website are for general informational and educational purposes only. We do not claim any ownership over, nor do we intend to infringe upon, any trademarks, copyrights, logos, brand names, or other intellectual property mentioned or depicted on this site. Such intellectual property remains the property of its respective owners, and any references here are made solely for identification or informational purposes, without implying any affiliation, endorsement, or partnership.
We make no representations or warranties, express or implied, regarding the accuracy, completeness, or suitability of any content or products presented. Nothing on this website should be construed as legal, tax, investment, financial, medical, or other professional advice. In addition, no part of this site—including articles or product references—constitutes a solicitation, recommendation, endorsement, advertisement, or offer to buy or sell any securities, franchises, or other financial instruments, particularly in jurisdictions where such activity would be unlawful.
All content is of a general nature and may not address the specific circumstances of any individual or entity. It is not a substitute for professional advice or services. Any actions you take based on the information provided here are strictly at your own risk. You accept full responsibility for any decisions or outcomes arising from your use of this website and agree to release us from any liability in connection with your use of, or reliance upon, the content or products found herein.