
|
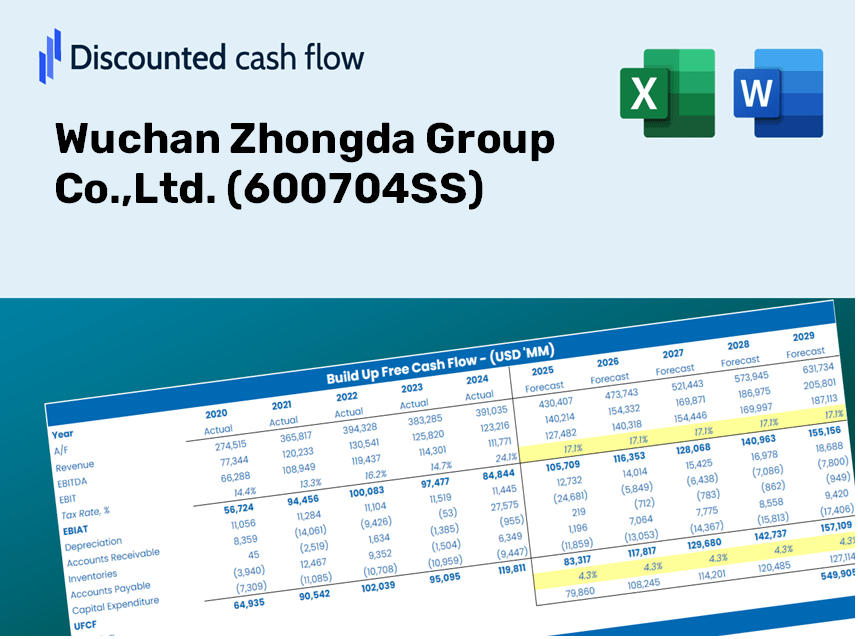
Wuchan Zhongda Group Co., Ltd. (600704.SS) DCF -Bewertung |
Fully Editable: Tailor To Your Needs In Excel Or Sheets
Professional Design: Trusted, Industry-Standard Templates
Investor-Approved Valuation Models
MAC/PC Compatible, Fully Unlocked
No Expertise Is Needed; Easy To Follow
Wuchan Zhongda Group Co.,Ltd. (600704.SS) Bundle
Optimieren Sie Ihre Analyse und verbessern Sie die Präzision mit unserem DCF -Taschenrechner (600704S)! Ausgestattet mit echten Daten von Wuchan Zhongda Group Co., Ltd. und anpassbaren Annahmen ermöglicht es Ihnen, wie ein erfahrener Investor prognostiziert, bewertet und value (600704S).
Discounted Cash Flow (DCF) - (USD MM)
| Year | AY1 2020 |
AY2 2021 |
AY3 2022 |
AY4 2023 |
AY5 2024 |
FY1 2025 |
FY2 2026 |
FY3 2027 |
FY4 2028 |
FY5 2029 |
|---|---|---|---|---|---|---|---|---|---|---|
| Revenue | 403,966.4 | 562,537.9 | 576,548.7 | 580,160.6 | 599,519.6 | 649,720.1 | 704,124.2 | 763,083.8 | 826,980.3 | 896,227.2 |
| Revenue Growth, % | 0 | 39.25 | 2.49 | 0.62647 | 3.34 | 8.37 | 8.37 | 8.37 | 8.37 | 8.37 |
| EBITDA | 6,752.7 | 7,774.1 | 6,930.0 | 8,059.8 | 5,274.3 | 8,478.2 | 9,188.2 | 9,957.5 | 10,791.3 | 11,694.9 |
| EBITDA, % | 1.67 | 1.38 | 1.2 | 1.39 | 0.87976 | 1.3 | 1.3 | 1.3 | 1.3 | 1.3 |
| Depreciation | 1,022.6 | 1,154.2 | 1,443.2 | 1,965.3 | 1,649.6 | 1,718.6 | 1,862.5 | 2,018.4 | 2,187.5 | 2,370.6 |
| Depreciation, % | 0.25314 | 0.20518 | 0.25032 | 0.33876 | 0.27516 | 0.26451 | 0.26451 | 0.26451 | 0.26451 | 0.26451 |
| EBIT | 5,730.1 | 6,619.9 | 5,486.8 | 6,094.5 | 3,624.7 | 6,759.7 | 7,325.7 | 7,939.1 | 8,603.9 | 9,324.3 |
| EBIT, % | 1.42 | 1.18 | 0.95165 | 1.05 | 0.6046 | 1.04 | 1.04 | 1.04 | 1.04 | 1.04 |
| Total Cash | 17,951.9 | 24,354.7 | 24,184.3 | 24,145.3 | 26,006.2 | 27,895.9 | 30,231.8 | 32,763.2 | 35,506.7 | 38,479.8 |
| Total Cash, percent | .0 | .0 | .0 | .0 | .0 | .0 | .0 | .0 | .0 | .0 |
| Account Receivables | 12,245.7 | 16,354.8 | 16,970.4 | 21,552.7 | 21,945.6 | 21,125.8 | 22,894.8 | 24,811.9 | 26,889.5 | 29,141.0 |
| Account Receivables, % | 3.03 | 2.91 | 2.94 | 3.71 | 3.66 | 3.25 | 3.25 | 3.25 | 3.25 | 3.25 |
| Inventories | 23,346.3 | 29,006.1 | 34,978.2 | 37,735.9 | 38,880.5 | 38,972.9 | 42,236.2 | 45,772.9 | 49,605.6 | 53,759.3 |
| Inventories, % | 5.78 | 5.16 | 6.07 | 6.5 | 6.49 | 6 | 6 | 6 | 6 | 6 |
| Accounts Payable | 23,168.8 | 11,119.7 | 30,882.7 | 12,738.0 | 34,263.2 | 27,261.2 | 29,543.9 | 32,017.8 | 34,698.8 | 37,604.3 |
| Accounts Payable, % | 5.74 | 1.98 | 5.36 | 2.2 | 5.72 | 4.2 | 4.2 | 4.2 | 4.2 | 4.2 |
| Capital Expenditure | -2,247.9 | -3,554.7 | -3,717.7 | -2,534.1 | -3,267.2 | -3,657.8 | -3,964.1 | -4,296.1 | -4,655.8 | -5,045.6 |
| Capital Expenditure, % | -0.55645 | -0.6319 | -0.64482 | -0.43679 | -0.54497 | -0.56299 | -0.56299 | -0.56299 | -0.56299 | -0.56299 |
| Tax Rate, % | 52.54 | 52.54 | 52.54 | 52.54 | 52.54 | 52.54 | 52.54 | 52.54 | 52.54 | 52.54 |
| EBITAT | 2,891.4 | 3,534.6 | 2,773.3 | 3,020.2 | 1,720.2 | 3,398.9 | 3,683.5 | 3,992.0 | 4,326.2 | 4,688.5 |
| Depreciation | ||||||||||
| Changes in Account Receivables | ||||||||||
| Changes in Inventories | ||||||||||
| Changes in Accounts Payable | ||||||||||
| Capital Expenditure | ||||||||||
| UFCF | -10,757.1 | -20,683.9 | 13,674.1 | -23,033.3 | 20,090.5 | -4,815.0 | -1,167.7 | -1,265.5 | -1,371.5 | -1,486.3 |
| WACC, % | 4.5 | 4.58 | 4.5 | 4.47 | 4.42 | 4.49 | 4.49 | 4.49 | 4.49 | 4.49 |
| PV UFCF | ||||||||||
| SUM PV UFCF | -9,130.0 | |||||||||
| Long Term Growth Rate, % | 3.50 | |||||||||
| Free cash flow (T + 1) | -1,538 | |||||||||
| Terminal Value | -154,829 | |||||||||
| Present Terminal Value | -124,281 | |||||||||
| Enterprise Value | -133,411 | |||||||||
| Net Debt | 9,395 | |||||||||
| Equity Value | -142,806 | |||||||||
| Diluted Shares Outstanding, MM | 5,309 | |||||||||
| Equity Value Per Share | -26.90 |
What You Will Receive
- Authentic Wuchan Zhongda Financials: Access to historical and projected data for precise valuation.
- Customizable Inputs: Adjust WACC, tax rates, revenue growth, and capital expenditures as needed.
- Real-Time Calculations: Dynamic computation of intrinsic value and NPV.
- Comprehensive Scenario Analysis: Evaluate various scenarios to assess the future performance of Wuchan Zhongda Group Co., Ltd. (600704SS).
- User-Friendly Design: Designed for professionals but easy enough for newcomers to navigate.
Key Features
- Accurate Wuchan Zhongda Data: Pre-filled with Wuchan Zhongda Group’s historical financial performance and future growth forecasts.
- Comprehensive Input Customization: Modify revenue growth, profit margins, discount rates, tax percentages, and capital investments.
- Interactive Valuation Model: Automatic recalculations of Net Present Value (NPV) and intrinsic value in response to your adjustments.
- Scenario Analysis: Develop various forecasting scenarios to evaluate diverse valuation results.
- Intuitive User Interface: Designed for ease of use, catering to both professionals and newcomers.
How It Functions
- Download: Obtain the user-friendly Excel file containing Wuchan Zhongda Group Co., Ltd.'s (600704SS) financial metrics.
- Customize: Tailor projections, such as revenue growth, EBITDA percentage, and WACC.
- Real-Time Updates: The intrinsic value and NPV calculations refresh automatically as you make changes.
- Scenario Testing: Generate various forecasts and analyze results instantly.
- Informed Decision-Making: Leverage the valuation insights to shape your investment approach.
Why Opt for Wuchan Zhongda Group's Calculator?
- All-in-One Solution: Features DCF, WACC, and financial ratio analyses all in a single platform.
- Flexible Inputs: Modify the highlighted cells to explore different scenarios.
- In-Depth Analysis: Automatically computes the intrinsic value and Net Present Value for Wuchan Zhongda Group (600704SS).
- Ready-to-Use Data: Comes with historical and projected data for precise calculations.
- High Professional Standard: Perfect for financial analysts, investors, and business consultants alike.
Who Should Use This Product?
- Investors: Assess Wuchan Zhongda Group Co., Ltd.'s (600704SS) valuation prior to making investment decisions.
- CFOs and Financial Analysts: Optimize valuation workflows and evaluate financial forecasts.
- Startup Founders: Understand the valuation methodologies applied to large enterprises like Wuchan Zhongda Group Co., Ltd. (600704SS).
- Consultants: Create detailed valuation reports for clients utilizing Wuchan Zhongda Group Co., Ltd. (600704SS) data.
- Students and Educators: Leverage real-time data to practice and impart valuation strategies.
Contents of the Template
- Preloaded Wuchan Zhongda Data: Historical and projected financial information, including revenue, EBIT, and capital expenditures.
- DCF and WACC Models: Advanced spreadsheets for calculating intrinsic value and Weighted Average Cost of Capital.
- Editable Inputs: Yellow-highlighted cells for customizing revenue growth, tax rates, and discount rates.
- Financial Statements: Detailed annual and quarterly financials for in-depth analysis.
- Key Ratios: Ratios for profitability, leverage, and efficiency to assess performance.
- Dashboard and Charts: Visual representations of valuation results and assumptions.
Disclaimer
All information, articles, and product details provided on this website are for general informational and educational purposes only. We do not claim any ownership over, nor do we intend to infringe upon, any trademarks, copyrights, logos, brand names, or other intellectual property mentioned or depicted on this site. Such intellectual property remains the property of its respective owners, and any references here are made solely for identification or informational purposes, without implying any affiliation, endorsement, or partnership.
We make no representations or warranties, express or implied, regarding the accuracy, completeness, or suitability of any content or products presented. Nothing on this website should be construed as legal, tax, investment, financial, medical, or other professional advice. In addition, no part of this site—including articles or product references—constitutes a solicitation, recommendation, endorsement, advertisement, or offer to buy or sell any securities, franchises, or other financial instruments, particularly in jurisdictions where such activity would be unlawful.
All content is of a general nature and may not address the specific circumstances of any individual or entity. It is not a substitute for professional advice or services. Any actions you take based on the information provided here are strictly at your own risk. You accept full responsibility for any decisions or outcomes arising from your use of this website and agree to release us from any liability in connection with your use of, or reliance upon, the content or products found herein.