
|
Tianjin Port Co., Ltd. (600717.SS) DCF -Bewertung |
Fully Editable: Tailor To Your Needs In Excel Or Sheets
Professional Design: Trusted, Industry-Standard Templates
Investor-Approved Valuation Models
MAC/PC Compatible, Fully Unlocked
No Expertise Is Needed; Easy To Follow
Tianjin Port Co., Ltd. (600717.SS) Bundle
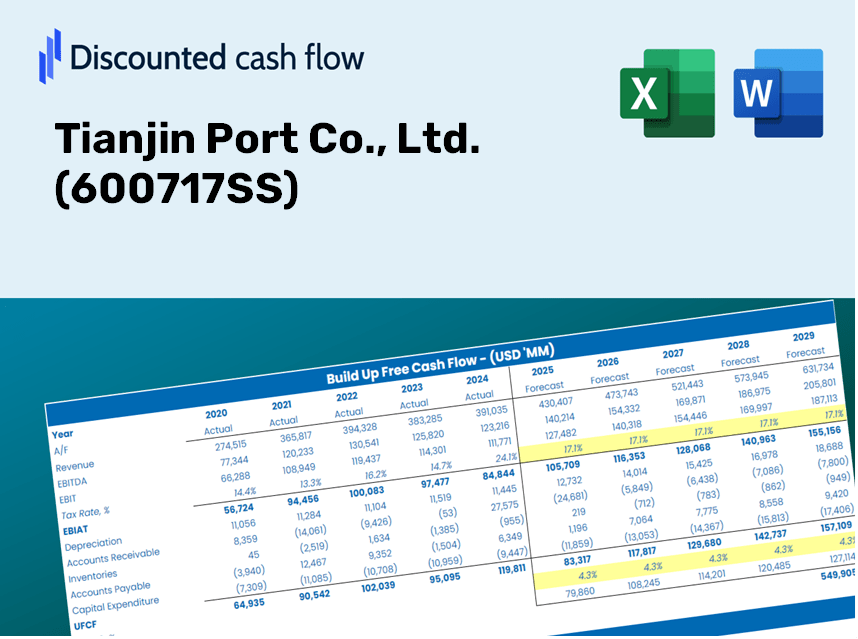
Gewinnen Sie Einblick in Ihre Tianjin Port Co., Ltd. (600717) Bewertungsanalyse mit unserem ausgefeilten DCF -Taschenrechner! Diese Excel -Vorlage mit realen (600717-) Daten (600717), ermöglicht es Ihnen, Prognosen und Annahmen anzupassen, um den inneren Wert von Tianjin Port Co., Ltd., mit Genauigkeit zu bestimmen.
Discounted Cash Flow (DCF) - (USD MM)
| Year | AY1 2020 |
AY2 2021 |
AY3 2022 |
AY4 2023 |
AY5 2024 |
FY1 2025 |
FY2 2026 |
FY3 2027 |
FY4 2028 |
FY5 2029 |
|---|---|---|---|---|---|---|---|---|---|---|
| Revenue | 13,851.6 | 14,468.3 | 10,822.0 | 11,704.0 | 12,070.0 | 11,784.1 | 11,505.0 | 11,232.5 | 10,966.5 | 10,706.8 |
| Revenue Growth, % | 0 | 4.45 | -25.2 | 8.15 | 3.13 | -2.37 | -2.37 | -2.37 | -2.37 | -2.37 |
| EBITDA | 2,670.1 | 2,704.4 | 2,300.6 | 2,592.8 | 2,769.3 | 2,458.7 | 2,400.5 | 2,343.7 | 2,288.1 | 2,234.0 |
| EBITDA, % | 19.28 | 18.69 | 21.26 | 22.15 | 22.94 | 20.86 | 20.86 | 20.86 | 20.86 | 20.86 |
| Depreciation | 1,208.0 | 1,210.1 | 1,096.3 | 1,107.2 | 1,091.5 | 1,077.5 | 1,052.0 | 1,027.0 | 1,002.7 | 979.0 |
| Depreciation, % | 8.72 | 8.36 | 10.13 | 9.46 | 9.04 | 9.14 | 9.14 | 9.14 | 9.14 | 9.14 |
| EBIT | 1,462.1 | 1,494.4 | 1,204.4 | 1,485.6 | 1,677.9 | 1,381.3 | 1,348.6 | 1,316.6 | 1,285.4 | 1,255.0 |
| EBIT, % | 10.56 | 10.33 | 11.13 | 12.69 | 13.9 | 11.72 | 11.72 | 11.72 | 11.72 | 11.72 |
| Total Cash | 4,837.2 | 4,772.2 | 4,338.6 | 4,987.9 | 5,562.9 | 4,635.9 | 4,526.1 | 4,418.9 | 4,314.3 | 4,212.1 |
| Total Cash, percent | .0 | .0 | .0 | .0 | .0 | .0 | .0 | .0 | .0 | .0 |
| Account Receivables | 2,363.8 | 2,130.6 | 1,610.2 | 1,646.5 | 1,759.2 | 1,775.0 | 1,733.0 | 1,691.9 | 1,651.9 | 1,612.7 |
| Account Receivables, % | 17.06 | 14.73 | 14.88 | 14.07 | 14.58 | 15.06 | 15.06 | 15.06 | 15.06 | 15.06 |
| Inventories | 256.8 | 56.4 | 83.3 | 46.2 | 48.2 | 89.7 | 87.6 | 85.5 | 83.5 | 81.5 |
| Inventories, % | 1.85 | 0.38951 | 0.76965 | 0.3946 | 0.39934 | 0.76148 | 0.76148 | 0.76148 | 0.76148 | 0.76148 |
| Accounts Payable | 2,474.9 | 2,436.7 | 1,933.6 | 1,882.0 | 2,269.3 | 2,061.2 | 2,012.4 | 1,964.7 | 1,918.2 | 1,872.8 |
| Accounts Payable, % | 17.87 | 16.84 | 17.87 | 16.08 | 18.8 | 17.49 | 17.49 | 17.49 | 17.49 | 17.49 |
| Capital Expenditure | -647.8 | -943.1 | -1,146.8 | -975.1 | -947.0 | -894.9 | -873.7 | -853.0 | -832.8 | -813.0 |
| Capital Expenditure, % | -4.68 | -6.52 | -10.6 | -8.33 | -7.85 | -7.59 | -7.59 | -7.59 | -7.59 | -7.59 |
| Tax Rate, % | 47.98 | 47.98 | 47.98 | 47.98 | 47.98 | 47.98 | 47.98 | 47.98 | 47.98 | 47.98 |
| EBITAT | 682.4 | 803.5 | 597.3 | 828.3 | 872.8 | 712.2 | 695.3 | 678.9 | 662.8 | 647.1 |
| Depreciation | ||||||||||
| Changes in Account Receivables | ||||||||||
| Changes in Inventories | ||||||||||
| Changes in Accounts Payable | ||||||||||
| Capital Expenditure | ||||||||||
| UFCF | 1,096.9 | 1,466.1 | 536.9 | 909.7 | 1,289.7 | 629.5 | 869.0 | 848.4 | 828.3 | 808.7 |
| WACC, % | 4.5 | 4.59 | 4.54 | 4.62 | 4.57 | 4.56 | 4.56 | 4.56 | 4.56 | 4.56 |
| PV UFCF | ||||||||||
| SUM PV UFCF | 3,478.7 | |||||||||
| Long Term Growth Rate, % | 2.00 | |||||||||
| Free cash flow (T + 1) | 825 | |||||||||
| Terminal Value | 32,179 | |||||||||
| Present Terminal Value | 25,744 | |||||||||
| Enterprise Value | 29,223 | |||||||||
| Net Debt | -1,786 | |||||||||
| Equity Value | 31,009 | |||||||||
| Diluted Shares Outstanding, MM | 2,894 | |||||||||
| Equity Value Per Share | 10.71 |
Benefits You Will Receive
- Comprehensive Financial Model: Utilizes Tianjin Port Co., Ltd.'s actual data for accurate DCF valuation.
- Complete Forecasting Flexibility: Modify revenue growth, profit margins, WACC, and other essential variables.
- Real-Time Calculations: Instant updates ensure you view results immediately as adjustments are made.
- Professional-Grade Template: An expertly crafted Excel file tailored for high-quality valuation.
- Customizable and Reusable: Designed for adaptability, facilitating repeated use for in-depth forecasts.
Key Features
- Customizable Forecast Inputs: Adjust essential parameters such as cargo volume growth, revenue per ton, and operational expenses.
- Instant DCF Valuation: Automatically computes intrinsic value, net present value, and other financial metrics in real-time.
- High-Precision Accuracy: Leverages Tianjin Port's actual financial data for dependable valuation results.
- Effortless Scenario Analysis: Easily explore various assumptions and evaluate results side-by-side.
- Time-Efficient Solution: Say goodbye to the complexities of creating valuation models from the ground up.
How It Works
- Step 1: Download the Excel file for Tianjin Port Co., Ltd. (600717SS).
- Step 2: Review the pre-filled data for Tianjin Port (historical and projected).
- Step 3: Modify the key assumptions (yellow cells) according to your analysis.
- Step 4: Observe the automatic recalculations for Tianjin Port's intrinsic value.
- Step 5: Utilize the results for investment decisions or reporting purposes.
Why Choose This Calculator for Tianjin Port Co., Ltd. (600717SS)?
- Designed for Experts: A sophisticated tool utilized by financial analysts, CFOs, and industry consultants.
- Accurate Data: Historical and projected financial information for Tianjin Port Co., Ltd. preloaded for precision.
- Flexible Scenario Analysis: Effortlessly simulate various forecasts and assumptions.
- Transparent Results: Instantly computes intrinsic value, NPV, and essential financial metrics.
- User-Friendly: Step-by-step guidance ensures a smooth experience throughout the process.
Who Should Utilize This Service?
- Logistics Students: Explore supply chain management techniques and apply them with real-world data.
- Researchers: Integrate industry-specific models into academic projects or studies.
- Investors: Validate your investment strategies and evaluate the performance of Tianjin Port Co., Ltd. (600717SS).
- Market Analysts: Enhance your analysis process with a ready-to-use, customizable financial model.
- Port Operators: Understand how major companies like Tianjin Port Co., Ltd. (600717SS) operate and are assessed in the market.
Contents of the Template
- Pre-Filled Data: Contains Tianjin Port Co., Ltd.'s historical financial performance and projections.
- Discounted Cash Flow Model: An adjustable DCF valuation model featuring automatic calculations.
- Weighted Average Cost of Capital (WACC): A specific worksheet for computing WACC using user-defined inputs.
- Key Financial Ratios: Evaluate Tianjin Port Co., Ltd.'s profitability, efficiency, and capital structure.
- Customizable Inputs: Easily modify revenue growth rates, profit margins, and tax rates.
- User-Friendly Dashboard: Visualizations and tables that encapsulate the main valuation outcomes.
Disclaimer
All information, articles, and product details provided on this website are for general informational and educational purposes only. We do not claim any ownership over, nor do we intend to infringe upon, any trademarks, copyrights, logos, brand names, or other intellectual property mentioned or depicted on this site. Such intellectual property remains the property of its respective owners, and any references here are made solely for identification or informational purposes, without implying any affiliation, endorsement, or partnership.
We make no representations or warranties, express or implied, regarding the accuracy, completeness, or suitability of any content or products presented. Nothing on this website should be construed as legal, tax, investment, financial, medical, or other professional advice. In addition, no part of this site—including articles or product references—constitutes a solicitation, recommendation, endorsement, advertisement, or offer to buy or sell any securities, franchises, or other financial instruments, particularly in jurisdictions where such activity would be unlawful.
All content is of a general nature and may not address the specific circumstances of any individual or entity. It is not a substitute for professional advice or services. Any actions you take based on the information provided here are strictly at your own risk. You accept full responsibility for any decisions or outcomes arising from your use of this website and agree to release us from any liability in connection with your use of, or reliance upon, the content or products found herein.