
|
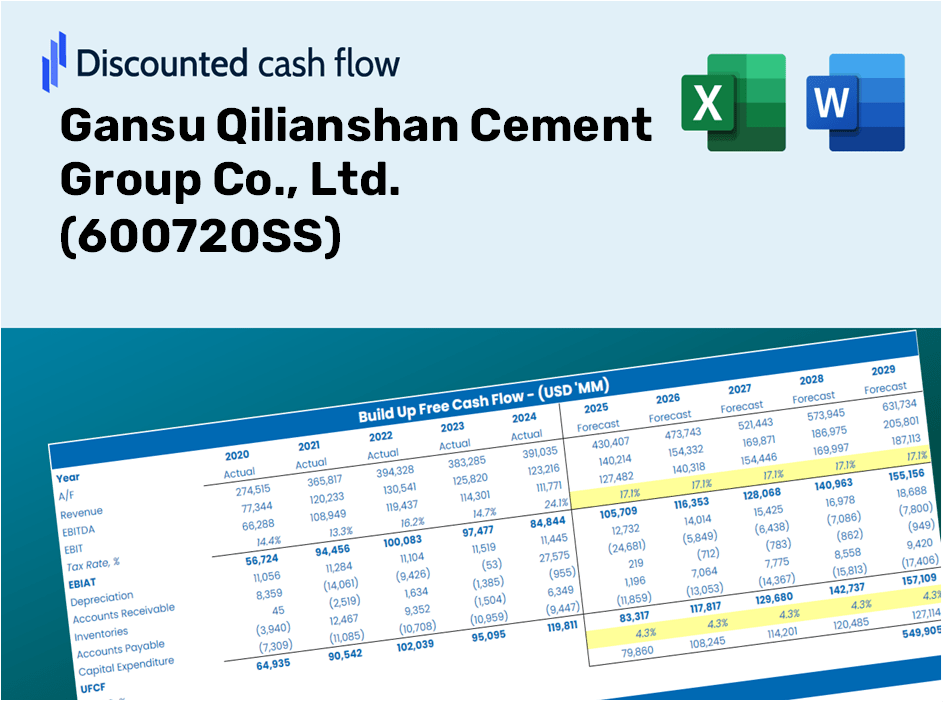
Gansu Qilianshan Cement Group Co., Ltd. (600720.SS) DCF -Bewertung |
Fully Editable: Tailor To Your Needs In Excel Or Sheets
Professional Design: Trusted, Industry-Standard Templates
Investor-Approved Valuation Models
MAC/PC Compatible, Fully Unlocked
No Expertise Is Needed; Easy To Follow
Gansu Qilianshan Cement Group Co., Ltd. (600720.SS) Bundle
Bewerten Sie die finanzielle Aussichten von Gansu Qilianshan Cement Group Co., Ltd. (600720S) wie ein Experte! Dieser (600720SS) DCF-Taschenrechner bietet vorgefüllte Finanzdaten sowie die Flexibilität, das Umsatzwachstum, die WACC, die Margen und die anderen wichtigen Annahmen zu ändern, um sich an Ihren Projektionen auszurichten.
Discounted Cash Flow (DCF) - (USD MM)
| Year | AY1 2020 |
AY2 2021 |
AY3 2022 |
AY4 2023 |
AY5 2024 |
FY1 2025 |
FY2 2026 |
FY3 2027 |
FY4 2028 |
FY5 2029 |
|---|---|---|---|---|---|---|---|---|---|---|
| Revenue | 7,811.7 | 7,672.5 | 7,973.8 | 13,511.5 | 12,433.8 | 12,813.2 | 13,204.2 | 13,607.1 | 14,022.3 | 14,450.2 |
| Revenue Growth, % | 0 | -1.78 | 3.93 | 69.45 | -7.98 | 3.05 | 3.05 | 3.05 | 3.05 | 3.05 |
| EBITDA | 2,406.1 | 1,851.8 | 2,340.8 | 2,336.2 | 2,330.8 | 3,083.6 | 3,177.7 | 3,274.7 | 3,374.6 | 3,477.6 |
| EBITDA, % | 30.8 | 24.14 | 29.36 | 17.29 | 18.75 | 24.07 | 24.07 | 24.07 | 24.07 | 24.07 |
| Depreciation | 587.7 | 632.4 | 183.5 | 177.2 | 188.4 | 535.5 | 551.8 | 568.6 | 586.0 | 603.9 |
| Depreciation, % | 7.52 | 8.24 | 2.3 | 1.31 | 1.52 | 4.18 | 4.18 | 4.18 | 4.18 | 4.18 |
| EBIT | 1,818.4 | 1,219.4 | 2,157.2 | 2,159.0 | 2,142.4 | 2,548.2 | 2,625.9 | 2,706.0 | 2,788.6 | 2,873.7 |
| EBIT, % | 23.28 | 15.89 | 27.05 | 15.98 | 17.23 | 19.89 | 19.89 | 19.89 | 19.89 | 19.89 |
| Total Cash | 1,148.7 | 790.6 | 1,073.4 | 6,406.2 | 7,661.9 | 3,780.0 | 3,895.4 | 4,014.2 | 4,136.7 | 4,262.9 |
| Total Cash, percent | .0 | .0 | .0 | .0 | .0 | .0 | .0 | .0 | .0 | .0 |
| Account Receivables | 608.4 | 698.3 | .0 | 8,828.5 | 12,410.4 | 4,665.1 | 4,807.4 | 4,954.1 | 5,105.3 | 5,261.1 |
| Account Receivables, % | 7.79 | 9.1 | 0 | 65.34 | 99.81 | 36.41 | 36.41 | 36.41 | 36.41 | 36.41 |
| Inventories | 486.1 | 825.7 | 765.5 | 28.7 | 22.2 | 691.3 | 712.4 | 734.1 | 756.5 | 779.6 |
| Inventories, % | 6.22 | 10.76 | 9.6 | 0.21272 | 0.17821 | 5.4 | 5.4 | 5.4 | 5.4 | 5.4 |
| Accounts Payable | 869.4 | 1,174.4 | 7,817.8 | 6,922.9 | 7,714.4 | 6,093.0 | 6,278.9 | 6,470.5 | 6,667.9 | 6,871.4 |
| Accounts Payable, % | 11.13 | 15.31 | 98.04 | 51.24 | 62.04 | 47.55 | 47.55 | 47.55 | 47.55 | 47.55 |
| Capital Expenditure | -1,175.5 | -1,279.5 | -432.6 | -299.9 | -249.6 | -1,060.3 | -1,092.7 | -1,126.0 | -1,160.4 | -1,195.8 |
| Capital Expenditure, % | -15.05 | -16.68 | -5.43 | -2.22 | -2.01 | -8.28 | -8.28 | -8.28 | -8.28 | -8.28 |
| Tax Rate, % | 16.17 | 16.17 | 16.17 | 16.17 | 16.17 | 16.17 | 16.17 | 16.17 | 16.17 | 16.17 |
| EBITAT | 1,430.6 | 951.9 | 1,621.7 | 1,815.1 | 1,796.0 | 2,037.6 | 2,099.7 | 2,163.8 | 2,229.8 | 2,297.9 |
| Depreciation | ||||||||||
| Changes in Account Receivables | ||||||||||
| Changes in Inventories | ||||||||||
| Changes in Accounts Payable | ||||||||||
| Capital Expenditure | ||||||||||
| UFCF | 617.6 | 180.4 | 8,774.5 | -7,294.3 | -1,049.0 | 6,967.4 | 1,581.3 | 1,629.6 | 1,679.3 | 1,730.5 |
| WACC, % | 5.55 | 5.55 | 5.54 | 5.57 | 5.57 | 5.55 | 5.55 | 5.55 | 5.55 | 5.55 |
| PV UFCF | ||||||||||
| SUM PV UFCF | 12,079.3 | |||||||||
| Long Term Growth Rate, % | 2.00 | |||||||||
| Free cash flow (T + 1) | 1,765 | |||||||||
| Terminal Value | 49,674 | |||||||||
| Present Terminal Value | 37,911 | |||||||||
| Enterprise Value | 49,991 | |||||||||
| Net Debt | -6,573 | |||||||||
| Equity Value | 56,564 | |||||||||
| Diluted Shares Outstanding, MM | 2,120 | |||||||||
| Equity Value Per Share | 26.68 |
Benefits of Choosing Gansu Qilianshan Cement Group Co., Ltd. (600720SS)
- Comprehensive Financial Data: Access to both historical and projected financials for precise valuation.
- Customizable Variables: Adjust key metrics such as WACC, tax rates, revenue growth, and capital expenditures.
- Instantaneous Calculations: Intrinsic value and NPV are computed in real-time.
- Scenario Modeling: Evaluate various scenarios to project Gansu Qilianshan's future performance.
- User-Friendly Interface: Designed for industry professionals while remaining approachable for newcomers.
Key Features
- 🔍 Real-Life Gansu Qilianshan Financials: Access pre-filled historical and projected data for Gansu Qilianshan Cement Group Co., Ltd. (600720SS).
- ✏️ Fully Customizable Inputs: Modify all essential parameters (yellow cells) such as WACC, growth %, and tax rates.
- 📊 Professional DCF Valuation: Leverage integrated formulas to compute the intrinsic value of Gansu Qilianshan using the Discounted Cash Flow method.
- ⚡ Instant Results: Get immediate visualizations of Gansu Qilianshan’s valuation as soon as adjustments are made.
- Scenario Analysis: Evaluate and compare different outcomes based on various financial assumptions side-by-side.
How It Functions
- Download: Obtain the preformatted Excel file containing Gansu Qilianshan Cement Group Co., Ltd.'s financial data.
- Customize: Modify projections, including revenue growth rates, EBITDA percentage, and WACC.
- Automatic Updates: The calculations for intrinsic value and NPV refresh in real-time.
- Scenario Testing: Generate various forecasts and compare results instantly.
- Decision Making: Utilize the valuation outcomes to inform your investment approach.
Why Choose This Calculator for Gansu Qilianshan Cement Group Co., Ltd. (600720SS)?
- User-Friendly Interface: Perfectly crafted for both novices and seasoned users.
- Customizable Parameters: Modify inputs effortlessly to suit your specific analysis.
- Real-Time Updates: Observe immediate changes to Gansu Qilianshan’s valuation as you adjust your inputs.
- Pre-Configured: Comes with Gansu Qilianshan’s financial data preloaded for swift analysis.
- Reputable Choice: Trusted by investors and analysts for making well-informed decisions.
Who Can Benefit from This Product?
- Cement Industry Students: Understand valuation methods and practice with real-world data.
- Researchers: Integrate leading industry models into your studies or projects.
- Investors: Evaluate your own hypotheses and assess valuation results for Gansu Qilianshan Cement Group Co., Ltd. (600720SS).
- Market Analysts: Enhance your efficiency with a customizable, pre-designed DCF model.
- Construction Business Owners: Discover how major public companies like Gansu Qilianshan are evaluated.
Contents of the Template
- Historical Data: Contains past financial information and baseline forecasts for Gansu Qilianshan Cement Group Co., Ltd. (600720SS).
- DCF and Levered DCF Models: Comprehensive templates designed to assess the intrinsic value of Gansu Qilianshan Cement Group Co., Ltd. (600720SS).
- WACC Sheet: Pre-calculated formulas for the Weighted Average Cost of Capital.
- Editable Inputs: Adjust key parameters such as growth rates, EBITDA percentages, and CAPEX assumptions.
- Quarterly and Annual Statements: An extensive overview of Gansu Qilianshan Cement Group Co., Ltd. (600720SS) financial performance.
- Interactive Dashboard: Dynamically visualize valuation results and future projections.
Disclaimer
All information, articles, and product details provided on this website are for general informational and educational purposes only. We do not claim any ownership over, nor do we intend to infringe upon, any trademarks, copyrights, logos, brand names, or other intellectual property mentioned or depicted on this site. Such intellectual property remains the property of its respective owners, and any references here are made solely for identification or informational purposes, without implying any affiliation, endorsement, or partnership.
We make no representations or warranties, express or implied, regarding the accuracy, completeness, or suitability of any content or products presented. Nothing on this website should be construed as legal, tax, investment, financial, medical, or other professional advice. In addition, no part of this site—including articles or product references—constitutes a solicitation, recommendation, endorsement, advertisement, or offer to buy or sell any securities, franchises, or other financial instruments, particularly in jurisdictions where such activity would be unlawful.
All content is of a general nature and may not address the specific circumstances of any individual or entity. It is not a substitute for professional advice or services. Any actions you take based on the information provided here are strictly at your own risk. You accept full responsibility for any decisions or outcomes arising from your use of this website and agree to release us from any liability in connection with your use of, or reliance upon, the content or products found herein.