
|
Huadian Energy Company Limited (600726.SS) DCF -Bewertung |
Fully Editable: Tailor To Your Needs In Excel Or Sheets
Professional Design: Trusted, Industry-Standard Templates
Investor-Approved Valuation Models
MAC/PC Compatible, Fully Unlocked
No Expertise Is Needed; Easy To Follow
Huadian Energy Company Limited (600726.SS) Bundle
Optimieren Sie Ihre Analyse und verbessern Sie die Präzision mit unserem DCF -Taschenrechner (600726S)! Mit dem Zugriff auf reale Huadian Energy Company Limited Data und anpassbare Annahmen ermöglicht dieses Tool, wie ein erfahrener Investor prognostiziert, analysieren und value (600726S).
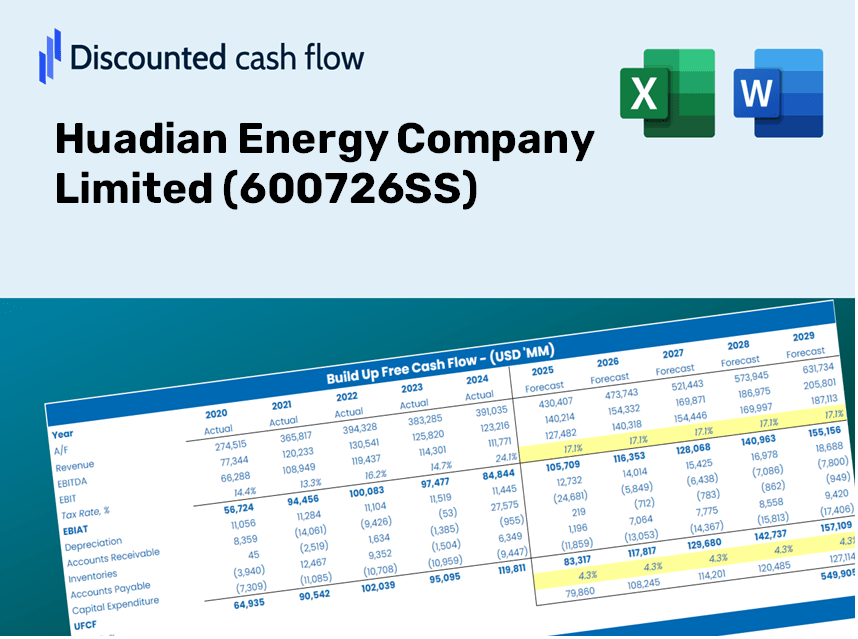
Discounted Cash Flow (DCF) - (USD MM)
| Year | AY1 2020 |
AY2 2021 |
AY3 2022 |
AY4 2023 |
AY5 2024 |
FY1 2025 |
FY2 2026 |
FY3 2027 |
FY4 2028 |
FY5 2029 |
|---|---|---|---|---|---|---|---|---|---|---|
| Revenue | 10,670.8 | 18,919.6 | 18,876.7 | 18,844.3 | 18,150.8 | 17,263.4 | 16,419.4 | 15,616.7 | 14,853.2 | 14,127.0 |
| Revenue Growth, % | 0 | 77.3 | -0.22705 | -0.17113 | -3.68 | -4.89 | -4.89 | -4.89 | -4.89 | -4.89 |
| EBITDA | 1,179.8 | 5,447.9 | 4,625.1 | 4,231.2 | 4,204.1 | 3,796.9 | 3,611.2 | 3,434.7 | 3,266.8 | 3,107.0 |
| EBITDA, % | 11.06 | 28.79 | 24.5 | 22.45 | 23.16 | 21.99 | 21.99 | 21.99 | 21.99 | 21.99 |
| Depreciation | 1,525.0 | 1,858.9 | 1,939.5 | 1,892.7 | 1,973.0 | 1,909.5 | 1,816.2 | 1,727.4 | 1,642.9 | 1,562.6 |
| Depreciation, % | 14.29 | 9.83 | 10.27 | 10.04 | 10.87 | 11.06 | 11.06 | 11.06 | 11.06 | 11.06 |
| EBIT | -345.2 | 3,589.0 | 2,685.5 | 2,338.5 | 2,231.1 | 1,887.3 | 1,795.1 | 1,707.3 | 1,623.8 | 1,544.4 |
| EBIT, % | -3.24 | 18.97 | 14.23 | 12.41 | 12.29 | 10.93 | 10.93 | 10.93 | 10.93 | 10.93 |
| Total Cash | 1,478.2 | 1,638.9 | 5,550.9 | 3,282.2 | 3,344.7 | 3,030.3 | 2,882.1 | 2,741.2 | 2,607.2 | 2,479.7 |
| Total Cash, percent | .0 | .0 | .0 | .0 | .0 | .0 | .0 | .0 | .0 | .0 |
| Account Receivables | 1,968.8 | .0 | 1,842.7 | 1,448.2 | 1,476.0 | 1,520.2 | 1,445.9 | 1,375.2 | 1,307.9 | 1,244.0 |
| Account Receivables, % | 18.45 | 0 | 9.76 | 7.68 | 8.13 | 8.81 | 8.81 | 8.81 | 8.81 | 8.81 |
| Inventories | 635.1 | 1,207.2 | 863.3 | 726.7 | 970.7 | 901.5 | 857.4 | 815.5 | 775.6 | 737.7 |
| Inventories, % | 5.95 | 6.38 | 4.57 | 3.86 | 5.35 | 5.22 | 5.22 | 5.22 | 5.22 | 5.22 |
| Accounts Payable | 1,900.5 | 2,337.3 | 2,571.2 | 2,174.3 | 2,168.3 | 2,322.6 | 2,209.1 | 2,101.1 | 1,998.3 | 1,900.6 |
| Accounts Payable, % | 17.81 | 12.35 | 13.62 | 11.54 | 11.95 | 13.45 | 13.45 | 13.45 | 13.45 | 13.45 |
| Capital Expenditure | -477.2 | -1,106.8 | -1,937.1 | -839.2 | -2,534.0 | -1,346.5 | -1,280.6 | -1,218.0 | -1,158.5 | -1,101.8 |
| Capital Expenditure, % | -4.47 | -5.85 | -10.26 | -4.45 | -13.96 | -7.8 | -7.8 | -7.8 | -7.8 | -7.8 |
| Tax Rate, % | 91.2 | 91.2 | 91.2 | 91.2 | 91.2 | 91.2 | 91.2 | 91.2 | 91.2 | 91.2 |
| EBITAT | -335.3 | -1,491.8 | -1,684.6 | -103.6 | 196.4 | 399.8 | 380.3 | 361.7 | 344.0 | 327.2 |
| Depreciation | ||||||||||
| Changes in Account Receivables | ||||||||||
| Changes in Inventories | ||||||||||
| Changes in Accounts Payable | ||||||||||
| Capital Expenditure | ||||||||||
| UFCF | 9.2 | 1,093.9 | -2,947.1 | 1,084.1 | -642.4 | 1,142.2 | 920.6 | 875.6 | 832.8 | 792.1 |
| WACC, % | 5.43 | 3.36 | 3.36 | 3.36 | 3.54 | 3.81 | 3.81 | 3.81 | 3.81 | 3.81 |
| PV UFCF | ||||||||||
| SUM PV UFCF | 4,111.7 | |||||||||
| Long Term Growth Rate, % | 0.50 | |||||||||
| Free cash flow (T + 1) | 796 | |||||||||
| Terminal Value | 24,061 | |||||||||
| Present Terminal Value | 19,960 | |||||||||
| Enterprise Value | 24,071 | |||||||||
| Net Debt | 7,228 | |||||||||
| Equity Value | 16,843 | |||||||||
| Diluted Shares Outstanding, MM | 8,276 | |||||||||
| Equity Value Per Share | 2.04 |
Benefits You Will Receive
- Genuine (600726SS) Financial Data: Includes Huadian Energy's historical and projected financial data for accurate assessments.
- Customizable Template: Easily adjust key inputs such as revenue growth, WACC, and EBITDA percentage.
- Instant Calculations: Observe immediate updates to Huadian's intrinsic value as you modify inputs.
- Expert Valuation Tool: Tailored for investors, analysts, and consultants aiming for precise DCF outcomes.
- Intuitive Interface: A straightforward layout and clear guidance suitable for users of all skill levels.
Key Features
- Comprehensive DCF Calculator: Features both unlevered and levered DCF valuation models tailored for Huadian Energy Company Limited (600726SS).
- WACC Calculator: A pre-configured Weighted Average Cost of Capital sheet with adjustable input parameters.
- Customizable Forecast Assumptions: Update growth rates, capital expenditures, and discount rates as needed.
- Integrated Financial Ratios: Evaluate profitability, leverage, and efficiency ratios specific to Huadian Energy Company Limited (600726SS).
- Visual Dashboard and Charts: Graphical representations summarizing essential valuation metrics for straightforward analysis.
How It Works
- Download the Template: Gain immediate access to the Excel-based Huadian Energy DCF Calculator.
- Input Your Assumptions: Modify the yellow-highlighted cells for growth rates, WACC, profit margins, and other variables.
- Instant Calculations: The model automatically recalculates the intrinsic value of Huadian Energy Company Limited (600726SS).
- Test Scenarios: Experiment with various assumptions to assess potential changes in valuation.
- Analyze and Decide: Leverage the results to inform your investment strategies or financial assessments.
Why Choose This Calculator for Huadian Energy Company Limited (600726SS)?
- User-Friendly Interface: Suitable for both novices and seasoned analysts.
- Customizable Inputs: Easily adjust parameters to align with your financial analysis.
- Real-Time Updates: Observe immediate changes to Huadian’s valuation with each input modification.
- Pre-Loaded Data: Comes with Huadian Energy's actual financial information for quick assessments.
- Preferred by Experts: Valued by investors and analysts for informed decision-making.
Who Can Benefit from Huadian Energy Company Limited (600726SS)?
- Investors: Gain insights and make informed decisions with our advanced valuation tool tailored for Huadian Energy.
- Financial Analysts: Streamline your workflow with a customizable DCF model specifically designed for Huadian Energy.
- Consultants: Effortlessly modify the template for impactful client presentations and comprehensive reports on Huadian Energy.
- Finance Enthusiasts: Enhance your grasp of valuation methodologies with practical examples related to Huadian Energy.
- Educators and Students: Utilize this resource as a hands-on learning aid in finance courses focused on energy sectors.
Contents of the Template
- Historical Data: Comprehensive records of Huadian Energy Company Limited’s past financial performance and baseline forecasts.
- DCF and Levered DCF Models: In-depth templates designed to assess the intrinsic value of Huadian Energy Company Limited (600726SS).
- WACC Sheet: Pre-configured calculations for the Weighted Average Cost of Capital.
- Editable Inputs: Adjust essential drivers such as growth rates, EBITDA percentages, and CAPEX assumptions.
- Quarterly and Annual Statements: A thorough analysis of Huadian Energy Company Limited’s financial statements.
- Interactive Dashboard: Dynamic visualization of valuation results and forecasts.
Disclaimer
All information, articles, and product details provided on this website are for general informational and educational purposes only. We do not claim any ownership over, nor do we intend to infringe upon, any trademarks, copyrights, logos, brand names, or other intellectual property mentioned or depicted on this site. Such intellectual property remains the property of its respective owners, and any references here are made solely for identification or informational purposes, without implying any affiliation, endorsement, or partnership.
We make no representations or warranties, express or implied, regarding the accuracy, completeness, or suitability of any content or products presented. Nothing on this website should be construed as legal, tax, investment, financial, medical, or other professional advice. In addition, no part of this site—including articles or product references—constitutes a solicitation, recommendation, endorsement, advertisement, or offer to buy or sell any securities, franchises, or other financial instruments, particularly in jurisdictions where such activity would be unlawful.
All content is of a general nature and may not address the specific circumstances of any individual or entity. It is not a substitute for professional advice or services. Any actions you take based on the information provided here are strictly at your own risk. You accept full responsibility for any decisions or outcomes arising from your use of this website and agree to release us from any liability in connection with your use of, or reliance upon, the content or products found herein.