
|
Jiangsu Zongyi Co., Ltd (600770.SS) DCF -Bewertung |
Fully Editable: Tailor To Your Needs In Excel Or Sheets
Professional Design: Trusted, Industry-Standard Templates
Investor-Approved Valuation Models
MAC/PC Compatible, Fully Unlocked
No Expertise Is Needed; Easy To Follow
Jiangsu Zongyi Co.,LTD (600770.SS) Bundle
Verbessern Sie Ihre Anlagestrategien mit dem DCF -Taschenrechner des Jiangsu Zongyi Co., Ltd (600770SS)! Erforschen Sie echte Finanzdaten, passen Sie Wachstumsprojektionen und -kosten an und beobachten Sie die unmittelbaren Auswirkungen dieser Veränderungen auf den inneren Wert von Jiangsu Zongyi Co., Ltd (600770SS).
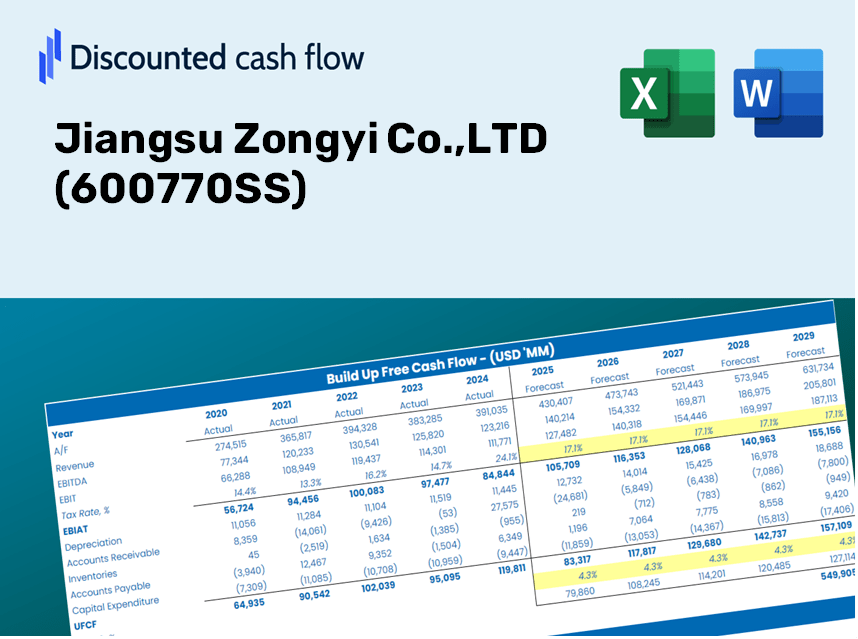
Discounted Cash Flow (DCF) - (USD MM)
| Year | AY1 2020 |
AY2 2021 |
AY3 2022 |
AY4 2023 |
AY5 2024 |
FY1 2025 |
FY2 2026 |
FY3 2027 |
FY4 2028 |
FY5 2029 |
|---|---|---|---|---|---|---|---|---|---|---|
| Revenue | 377.2 | 373.3 | 375.5 | 321.7 | 347.9 | 342.1 | 336.5 | 330.9 | 325.4 | 320.0 |
| Revenue Growth, % | 0 | -1.04 | 0.57448 | -14.33 | 8.15 | -1.66 | -1.66 | -1.66 | -1.66 | -1.66 |
| EBITDA | 64.1 | 54.6 | 102.1 | 52.9 | 62.8 | 63.8 | 62.8 | 61.7 | 60.7 | 59.7 |
| EBITDA, % | 16.99 | 14.62 | 27.18 | 16.43 | 18.04 | 18.65 | 18.65 | 18.65 | 18.65 | 18.65 |
| Depreciation | 100.6 | 96.5 | 95.4 | 94.2 | 102.1 | 93.4 | 91.9 | 90.4 | 88.9 | 87.4 |
| Depreciation, % | 26.66 | 25.86 | 25.4 | 29.27 | 29.35 | 27.31 | 27.31 | 27.31 | 27.31 | 27.31 |
| EBIT | -36.5 | -42.0 | 6.7 | -41.3 | -39.4 | -29.6 | -29.1 | -28.6 | -28.2 | -27.7 |
| EBIT, % | -9.66 | -11.24 | 1.78 | -12.84 | -11.31 | -8.66 | -8.66 | -8.66 | -8.66 | -8.66 |
| Total Cash | 1,924.3 | 2,000.4 | 1,659.6 | 1,526.5 | 1,653.2 | 342.1 | 336.5 | 330.9 | 325.4 | 320.0 |
| Total Cash, percent | .0 | .0 | .0 | .0 | .0 | .0 | .0 | .0 | .0 | .0 |
| Account Receivables | 159.5 | 155.4 | 146.3 | 181.0 | 210.2 | 163.9 | 161.2 | 158.5 | 155.9 | 153.3 |
| Account Receivables, % | 42.29 | 41.62 | 38.96 | 56.26 | 60.42 | 47.91 | 47.91 | 47.91 | 47.91 | 47.91 |
| Inventories | 76.6 | 72.2 | 70.1 | 59.3 | 131.4 | 78.3 | 77.0 | 75.8 | 74.5 | 73.3 |
| Inventories, % | 20.3 | 19.33 | 18.67 | 18.42 | 37.77 | 22.9 | 22.9 | 22.9 | 22.9 | 22.9 |
| Accounts Payable | 79.0 | 64.2 | 60.7 | 45.9 | 71.3 | 61.0 | 59.9 | 58.9 | 58.0 | 57.0 |
| Accounts Payable, % | 20.93 | 17.21 | 16.17 | 14.28 | 20.49 | 17.82 | 17.82 | 17.82 | 17.82 | 17.82 |
| Capital Expenditure | -182.0 | -90.4 | -54.8 | -24.3 | -45.7 | -73.7 | -72.5 | -71.3 | -70.1 | -69.0 |
| Capital Expenditure, % | -48.25 | -24.22 | -14.6 | -7.55 | -13.14 | -21.55 | -21.55 | -21.55 | -21.55 | -21.55 |
| Tax Rate, % | -213.17 | -213.17 | -213.17 | -213.17 | -213.17 | -213.17 | -213.17 | -213.17 | -213.17 | -213.17 |
| EBITAT | -20.2 | -20.4 | 4.4 | -27.5 | -123.3 | -19.9 | -19.6 | -19.3 | -19.0 | -18.6 |
| Depreciation | ||||||||||
| Changes in Account Receivables | ||||||||||
| Changes in Inventories | ||||||||||
| Changes in Accounts Payable | ||||||||||
| Capital Expenditure | ||||||||||
| UFCF | -258.9 | -20.4 | 52.5 | 3.8 | -142.9 | 88.8 | 2.8 | 2.7 | 2.7 | 2.6 |
| WACC, % | 4.72 | 4.7 | 4.74 | 4.74 | 4.81 | 4.74 | 4.74 | 4.74 | 4.74 | 4.74 |
| PV UFCF | ||||||||||
| SUM PV UFCF | 94.0 | |||||||||
| Long Term Growth Rate, % | 4.00 | |||||||||
| Free cash flow (T + 1) | 3 | |||||||||
| Terminal Value | 370 | |||||||||
| Present Terminal Value | 294 | |||||||||
| Enterprise Value | 388 | |||||||||
| Net Debt | -709 | |||||||||
| Equity Value | 1,097 | |||||||||
| Diluted Shares Outstanding, MM | 1,302 | |||||||||
| Equity Value Per Share | 0.84 |
What You Will Receive
- Flexible Forecast Inputs: Adjust assumptions (growth %, margins, WACC) effortlessly to explore various scenarios.
- Comprehensive Data: Jiangsu Zongyi Co., LTD’s financials pre-loaded to facilitate your analysis.
- Instant DCF Calculations: The model automatically computes Net Present Value (NPV) and intrinsic value for your convenience.
- Professional and Tailorable: A sleek Excel template designed to align with your valuation requirements.
- Engineered for Analysts and Investors: Perfect for evaluating projections, confirming strategies, and optimizing efficiency.
Key Features
- Real-Life JZYC Data: Comes pre-loaded with Jiangsu Zongyi Co., LTD’s historical financial data and future projections.
- Fully Customizable Inputs: Modify revenue growth rates, profit margins, WACC, tax rates, and capital expenditures to suit your analysis.
- Dynamic Valuation Model: Automatically updates Net Present Value (NPV) and intrinsic value based on your adjustments.
- Scenario Testing: Develop various forecasting scenarios to explore different valuation results.
- User-Friendly Design: Intuitive layout that caters to both professionals and newcomers.
How It Works
- 1. Access the Template: Download and open the Excel file featuring Jiangsu Zongyi Co.,LTD's preloaded data.
- 2. Modify Assumptions: Adjust key inputs such as growth rates, WACC, and capital expenditure figures.
- 3. View Results in Real-Time: The DCF model automatically calculates intrinsic value and NPV based on your inputs.
- 4. Explore Different Scenarios: Evaluate various forecasts to assess different valuation results.
- 5. Present with Assurance: Share professional valuation insights to strengthen your decision-making process.
Why Opt for This Calculator?
- Reliable Data: Accurate financials from Jiangsu Zongyi Co., LTD ([600770SS]) ensure trustworthy valuation outcomes.
- Customizable Options: Modify essential factors such as growth rates, WACC, and tax rates to reflect your forecasts.
- Efficiency Boost: Built-in calculations save you the hassle of starting from the ground up.
- Professional-Quality Tool: Tailored for investors, analysts, and consultants in the field.
- User-Centric Design: An intuitive interface and clear, step-by-step guidance make it accessible for all users.
Who Can Benefit from This Product?
- Institutional Investors: Develop comprehensive and accurate valuation models for investment assessment in Jiangsu Zongyi Co., LTD (600770SS).
- Corporate Finance Departments: Evaluate valuation scenarios to inform strategic decisions within their organizations.
- Financial Consultants and Advisors: Deliver precise valuation insights to clients considering investments in Jiangsu Zongyi Co., LTD (600770SS).
- Students and Instructors: Leverage real-world data for hands-on practice and teaching in financial modeling.
- Industry Enthusiasts: Gain insights into the valuation of companies like Jiangsu Zongyi Co., LTD (600770SS) within the tech market.
Contents of the Template
- Preloaded JZYC Data: Historical and projected financial information, including revenue, EBIT, and capital expenditures.
- DCF and WACC Models: Professional-grade spreadsheets for calculating intrinsic value and Weighted Average Cost of Capital.
- Editable Inputs: Yellow-highlighted cells for modifying revenue growth, tax rates, and discount rates.
- Financial Statements: Comprehensive annual and quarterly financial reports for detailed analysis.
- Key Ratios: Profitability, leverage, and efficiency ratios to assess performance.
- Dashboard and Charts: Visual summaries of valuation results and assumptions.
Disclaimer
All information, articles, and product details provided on this website are for general informational and educational purposes only. We do not claim any ownership over, nor do we intend to infringe upon, any trademarks, copyrights, logos, brand names, or other intellectual property mentioned or depicted on this site. Such intellectual property remains the property of its respective owners, and any references here are made solely for identification or informational purposes, without implying any affiliation, endorsement, or partnership.
We make no representations or warranties, express or implied, regarding the accuracy, completeness, or suitability of any content or products presented. Nothing on this website should be construed as legal, tax, investment, financial, medical, or other professional advice. In addition, no part of this site—including articles or product references—constitutes a solicitation, recommendation, endorsement, advertisement, or offer to buy or sell any securities, franchises, or other financial instruments, particularly in jurisdictions where such activity would be unlawful.
All content is of a general nature and may not address the specific circumstances of any individual or entity. It is not a substitute for professional advice or services. Any actions you take based on the information provided here are strictly at your own risk. You accept full responsibility for any decisions or outcomes arising from your use of this website and agree to release us from any liability in connection with your use of, or reliance upon, the content or products found herein.