
|
Guangyuyuan Chinese Herbal Medicine Co., Ltd. (600771.SS) DCF -Bewertung |
Fully Editable: Tailor To Your Needs In Excel Or Sheets
Professional Design: Trusted, Industry-Standard Templates
Investor-Approved Valuation Models
MAC/PC Compatible, Fully Unlocked
No Expertise Is Needed; Easy To Follow
GuangYuYuan Chinese Herbal Medicine Co., Ltd. (600771.SS) Bundle
Entdecken Sie das wahre Potenzial von Guangyuyuan Chinese Herbal Medicine Co., Ltd. (600771) mit unserem fortschrittlichen DCF -Taschenrechner! Passen Sie die entscheidenden Annahmen an, erkunden Sie verschiedene Szenarien und bewerten Sie die Auswirkungen von Änderungen auf die Bewertung von Guangyuyuan - alles bequem innerhalb einer Excel -Vorlage.
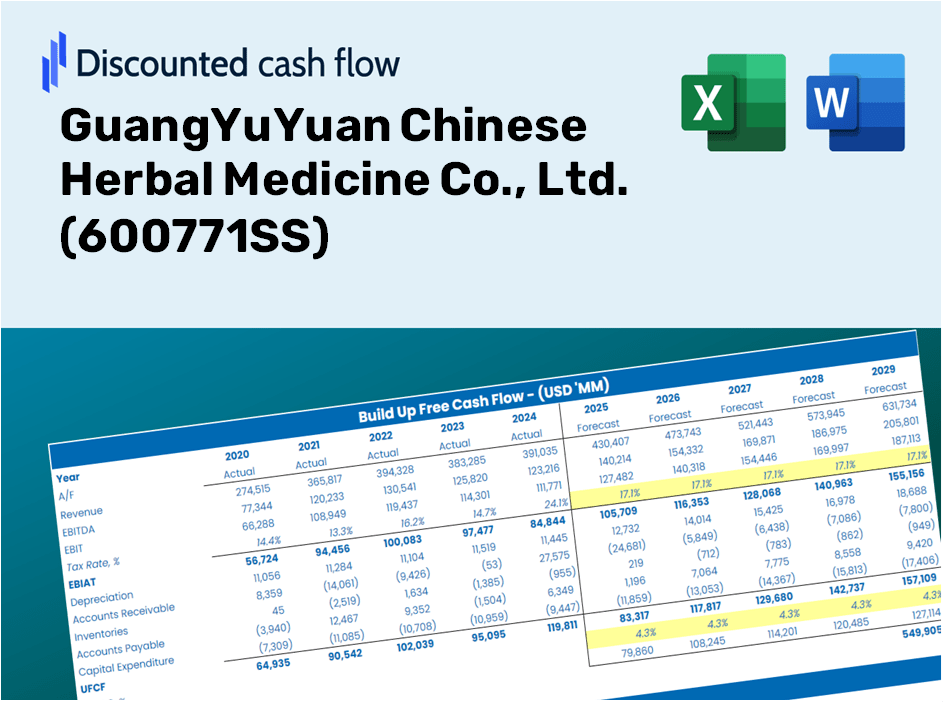
Discounted Cash Flow (DCF) - (USD MM)
| Year | AY1 2020 |
AY2 2021 |
AY3 2022 |
AY4 2023 |
AY5 2024 |
FY1 2025 |
FY2 2026 |
FY3 2027 |
FY4 2028 |
FY5 2029 |
|---|---|---|---|---|---|---|---|---|---|---|
| Revenue | 1,109.4 | 854.2 | 1,130.7 | 1,284.0 | 1,221.4 | 1,276.5 | 1,334.1 | 1,394.3 | 1,457.2 | 1,523.0 |
| Revenue Growth, % | 0 | -23 | 32.37 | 13.56 | -4.87 | 4.51 | 4.51 | 4.51 | 4.51 | 4.51 |
| EBITDA | 47.9 | -324.5 | -188.0 | 152.5 | 133.4 | -70.2 | -73.4 | -76.7 | -80.1 | -83.7 |
| EBITDA, % | 4.32 | -37.98 | -16.62 | 11.87 | 10.92 | -5.5 | -5.5 | -5.5 | -5.5 | -5.5 |
| Depreciation | 34.7 | 38.4 | 38.7 | 39.3 | 42.0 | 44.8 | 46.8 | 48.9 | 51.1 | 53.4 |
| Depreciation, % | 3.13 | 4.49 | 3.42 | 3.06 | 3.44 | 3.51 | 3.51 | 3.51 | 3.51 | 3.51 |
| EBIT | 13.2 | -362.8 | -226.7 | 113.2 | 91.4 | -115.0 | -120.2 | -125.6 | -131.2 | -137.2 |
| EBIT, % | 1.19 | -42.48 | -20.05 | 8.81 | 7.49 | -9.01 | -9.01 | -9.01 | -9.01 | -9.01 |
| Total Cash | 393.7 | 145.1 | 246.4 | 258.8 | 116.7 | 265.4 | 277.4 | 289.9 | 303.0 | 316.7 |
| Total Cash, percent | .0 | .0 | .0 | .0 | .0 | .0 | .0 | .0 | .0 | .0 |
| Account Receivables | 1,862.6 | 1,459.6 | 1,091.2 | 838.8 | 446.9 | 1,017.2 | 1,063.1 | 1,111.1 | 1,161.2 | 1,213.6 |
| Account Receivables, % | 167.89 | 170.87 | 96.51 | 65.32 | 36.59 | 79.68 | 79.68 | 79.68 | 79.68 | 79.68 |
| Inventories | 362.7 | 352.9 | 415.0 | 569.5 | 766.9 | 556.2 | 581.3 | 607.5 | 634.9 | 663.6 |
| Inventories, % | 32.69 | 41.31 | 36.71 | 44.36 | 62.79 | 43.57 | 43.57 | 43.57 | 43.57 | 43.57 |
| Accounts Payable | 785.3 | 489.1 | 156.7 | 76.4 | 72.7 | 392.7 | 410.4 | 428.9 | 448.3 | 468.5 |
| Accounts Payable, % | 70.79 | 57.25 | 13.86 | 5.95 | 5.95 | 30.76 | 30.76 | 30.76 | 30.76 | 30.76 |
| Capital Expenditure | -49.6 | -18.2 | -8.7 | -2.5 | -8.8 | -21.2 | -22.1 | -23.1 | -24.1 | -25.2 |
| Capital Expenditure, % | -4.48 | -2.13 | -0.7664 | -0.19559 | -0.71885 | -1.66 | -1.66 | -1.66 | -1.66 | -1.66 |
| Tax Rate, % | 7.91 | 7.91 | 7.91 | 7.91 | 7.91 | 7.91 | 7.91 | 7.91 | 7.91 | 7.91 |
| EBITAT | 24.2 | -325.4 | -213.8 | 101.6 | 84.2 | -107.1 | -111.9 | -117.0 | -122.3 | -127.8 |
| Depreciation | ||||||||||
| Changes in Account Receivables | ||||||||||
| Changes in Inventories | ||||||||||
| Changes in Accounts Payable | ||||||||||
| Capital Expenditure | ||||||||||
| UFCF | -1,430.8 | -188.7 | -209.9 | 156.1 | 308.1 | -123.0 | -140.5 | -146.9 | -153.5 | -160.4 |
| WACC, % | 5.93 | 5.92 | 5.92 | 5.92 | 5.92 | 5.92 | 5.92 | 5.92 | 5.92 | 5.92 |
| PV UFCF | ||||||||||
| SUM PV UFCF | -607.2 | |||||||||
| Long Term Growth Rate, % | 2.00 | |||||||||
| Free cash flow (T + 1) | -164 | |||||||||
| Terminal Value | -4,170 | |||||||||
| Present Terminal Value | -3,127 | |||||||||
| Enterprise Value | -3,735 | |||||||||
| Net Debt | -63 | |||||||||
| Equity Value | -3,672 | |||||||||
| Diluted Shares Outstanding, MM | 496 | |||||||||
| Equity Value Per Share | -7.40 |
Benefits of Choosing GuangYuYuan (600771SS)
- Comprehensive Financial Data: Access detailed historical and projected metrics for precise evaluations.
- Customizable Parameters: Adjust inputs such as WACC, tax rates, revenue growth, and capital expenditures.
- Dynamic Calculations: Instantaneous computation of intrinsic value and NPV for informed decision-making.
- Comprehensive Scenario Analysis: Analyze diverse scenarios to assess the future outlook of GuangYuYuan.
- User-Friendly Interface: Designed for industry professionals while remaining approachable for newcomers.
Key Features
- 🔍 Real-Life GYY Financials: Pre-filled historical and projected data for GuangYuYuan Chinese Herbal Medicine Co., Ltd. (600771SS).
- ✏️ Fully Customizable Inputs: Adjust all essential parameters (yellow cells) such as WACC, growth %, and tax rates.
- 📊 Professional DCF Valuation: Integrated formulas calculate the intrinsic value of GuangYuYuan using the Discounted Cash Flow method.
- ⚡ Instant Results: See the valuation of GuangYuYuan immediately after making adjustments.
- Scenario Analysis: Explore and compare results for different financial assumptions side-by-side.
How It Functions
- Step 1: Download the preconfigured Excel template featuring GuangYuYuan's data.
- Step 2: Review the filled sheets to familiarize yourself with essential metrics.
- Step 3: Adjust projections and assumptions in the customizable yellow cells (WACC, growth, margins).
- Step 4: Instantly see updated results, including GuangYuYuan's intrinsic value.
- Step 5: Utilize the outputs to make well-informed investment choices or create detailed reports.
Why Choose GuangYuYuan's Herbal Medicine Calculator?
- All-in-One Solution: Combines DCF, WACC, and financial ratio analyses seamlessly.
- Flexible Inputs: Modify the highlighted cells to explore different scenarios.
- In-Depth Analysis: Automatically computes the intrinsic value and Net Present Value for GuangYuYuan (600771SS).
- Built-In Data: Access to historical and projected data for precise calculations.
- Expert-Level Tool: Perfect for financial analysts, investors, and consultants in the herbal medicine sector.
Who Can Benefit from Our Products?
- Health Practitioners: Enhance treatment plans with effective Chinese herbal remedies.
- Nutritional Consultants: Integrate traditional Chinese medicine into holistic health strategies.
- Researchers: Explore the efficacy of herbal formulations for academic studies.
- Students and Instructors: Utilize authentic data to study and teach herbal medicine practices.
- Wellness Enthusiasts: Discover the benefits of traditional Chinese herbs for personal health.
Contents of the Template
- Pre-Filled Data: Contains GuangYuYuan's historical financial performance and projections.
- Discounted Cash Flow Model: An editable DCF valuation model equipped with automatic computation features.
- Weighted Average Cost of Capital (WACC): A dedicated worksheet for calculating WACC using customized inputs.
- Key Financial Ratios: Assess GuangYuYuan’s profitability, efficiency, and leverage metrics.
- Customizable Inputs: Easily modify assumptions regarding revenue growth, profit margins, and tax rates.
- Clear Dashboard: Visual representations and tables summarizing essential valuation outcomes.
Disclaimer
All information, articles, and product details provided on this website are for general informational and educational purposes only. We do not claim any ownership over, nor do we intend to infringe upon, any trademarks, copyrights, logos, brand names, or other intellectual property mentioned or depicted on this site. Such intellectual property remains the property of its respective owners, and any references here are made solely for identification or informational purposes, without implying any affiliation, endorsement, or partnership.
We make no representations or warranties, express or implied, regarding the accuracy, completeness, or suitability of any content or products presented. Nothing on this website should be construed as legal, tax, investment, financial, medical, or other professional advice. In addition, no part of this site—including articles or product references—constitutes a solicitation, recommendation, endorsement, advertisement, or offer to buy or sell any securities, franchises, or other financial instruments, particularly in jurisdictions where such activity would be unlawful.
All content is of a general nature and may not address the specific circumstances of any individual or entity. It is not a substitute for professional advice or services. Any actions you take based on the information provided here are strictly at your own risk. You accept full responsibility for any decisions or outcomes arising from your use of this website and agree to release us from any liability in connection with your use of, or reliance upon, the content or products found herein.