
|
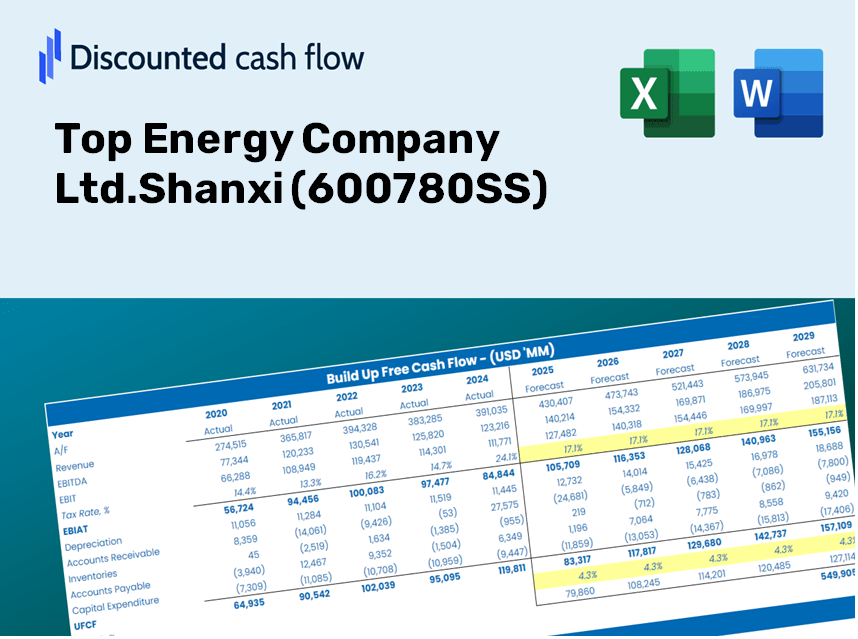
Top Energy Company Ltd.Shanxi (600780.SS) DCF -Bewertung |
Fully Editable: Tailor To Your Needs In Excel Or Sheets
Professional Design: Trusted, Industry-Standard Templates
Investor-Approved Valuation Models
MAC/PC Compatible, Fully Unlocked
No Expertise Is Needed; Easy To Follow
Top Energy Company Ltd.Shanxi (600780.SS) Bundle
Entdecken Sie das wahre Potenzial von Top Energy Company Ltd.Shanxi (600780S) mit unserem fortschrittlichen DCF -Taschenrechner! Passen Sie die wichtigsten Annahmen an, erkunden Sie verschiedene Szenarien und bewerten Sie, wie sich Änderungen auf die Bewertung von Top Energy Company Ltd.shanxi (600780S) auswirken - alles innerhalb einer einzigen Excel -Vorlage.
Discounted Cash Flow (DCF) - (USD MM)
| Year | AY1 2020 |
AY2 2021 |
AY3 2022 |
AY4 2023 |
AY5 2024 |
FY1 2025 |
FY2 2026 |
FY3 2027 |
FY4 2028 |
FY5 2029 |
|---|---|---|---|---|---|---|---|---|---|---|
| Revenue | 6,942.3 | 7,830.8 | 11,118.5 | 10,886.7 | 10,828.7 | 10,555.7 | 10,289.6 | 10,030.2 | 9,777.4 | 9,530.9 |
| Revenue Growth, % | 0 | 12.8 | 41.98 | -2.08 | -0.53345 | -2.52 | -2.52 | -2.52 | -2.52 | -2.52 |
| EBITDA | 1,115.7 | 1,043.6 | 1,767.0 | 1,601.8 | 1,444.4 | 1,548.3 | 1,509.3 | 1,471.3 | 1,434.2 | 1,398.0 |
| EBITDA, % | 16.07 | 13.33 | 15.89 | 14.71 | 13.34 | 14.67 | 14.67 | 14.67 | 14.67 | 14.67 |
| Depreciation | 697.6 | 705.8 | 694.9 | 732.6 | 747.2 | 822.1 | 801.4 | 781.2 | 761.5 | 742.3 |
| Depreciation, % | 10.05 | 9.01 | 6.25 | 6.73 | 6.9 | 7.79 | 7.79 | 7.79 | 7.79 | 7.79 |
| EBIT | 418.0 | 337.8 | 1,072.1 | 869.2 | 697.1 | 726.2 | 707.9 | 690.1 | 672.7 | 655.7 |
| EBIT, % | 6.02 | 4.31 | 9.64 | 7.98 | 6.44 | 6.88 | 6.88 | 6.88 | 6.88 | 6.88 |
| Total Cash | 1,436.7 | 1,655.3 | 2,016.0 | 2,219.8 | 2,475.6 | 2,179.0 | 2,124.1 | 2,070.5 | 2,018.4 | 1,967.5 |
| Total Cash, percent | .0 | .0 | .0 | .0 | .0 | .0 | .0 | .0 | .0 | .0 |
| Account Receivables | 362.9 | 302.0 | 1,219.6 | 930.4 | 1,108.6 | 819.9 | 799.2 | 779.1 | 759.4 | 740.3 |
| Account Receivables, % | 5.23 | 3.86 | 10.97 | 8.55 | 10.24 | 7.77 | 7.77 | 7.77 | 7.77 | 7.77 |
| Inventories | 112.2 | 97.4 | 117.3 | 103.5 | 158.9 | 133.7 | 130.3 | 127.0 | 123.8 | 120.7 |
| Inventories, % | 1.62 | 1.24 | 1.05 | 0.95054 | 1.47 | 1.27 | 1.27 | 1.27 | 1.27 | 1.27 |
| Accounts Payable | 532.6 | 656.4 | 1,510.1 | 1,076.3 | 1,220.4 | 1,072.3 | 1,045.2 | 1,018.9 | 993.2 | 968.2 |
| Accounts Payable, % | 7.67 | 8.38 | 13.58 | 9.89 | 11.27 | 10.16 | 10.16 | 10.16 | 10.16 | 10.16 |
| Capital Expenditure | -643.3 | -563.4 | -590.1 | -377.9 | -480.3 | -626.5 | -610.7 | -595.3 | -580.3 | -565.7 |
| Capital Expenditure, % | -9.27 | -7.2 | -5.31 | -3.47 | -4.44 | -5.94 | -5.94 | -5.94 | -5.94 | -5.94 |
| Tax Rate, % | 24.43 | 24.43 | 24.43 | 24.43 | 24.43 | 24.43 | 24.43 | 24.43 | 24.43 | 24.43 |
| EBITAT | 312.6 | 214.4 | 881.0 | 699.1 | 526.8 | 546.8 | 533.0 | 519.5 | 506.4 | 493.7 |
| Depreciation | ||||||||||
| Changes in Account Receivables | ||||||||||
| Changes in Inventories | ||||||||||
| Changes in Accounts Payable | ||||||||||
| Capital Expenditure | ||||||||||
| UFCF | 424.4 | 556.4 | 902.1 | 922.9 | 704.2 | 908.2 | 720.7 | 702.5 | 684.8 | 667.5 |
| WACC, % | 4.94 | 4.91 | 4.96 | 4.96 | 4.94 | 4.94 | 4.94 | 4.94 | 4.94 | 4.94 |
| PV UFCF | ||||||||||
| SUM PV UFCF | 3,216.8 | |||||||||
| Long Term Growth Rate, % | 3.00 | |||||||||
| Free cash flow (T + 1) | 688 | |||||||||
| Terminal Value | 35,403 | |||||||||
| Present Terminal Value | 27,816 | |||||||||
| Enterprise Value | 31,032 | |||||||||
| Net Debt | -2,345 | |||||||||
| Equity Value | 33,377 | |||||||||
| Diluted Shares Outstanding, MM | 1,146 | |||||||||
| Equity Value Per Share | 29.11 |
What You Will Receive
- Genuine (600780SS) Financial Data: Filled with historical and projected data for Top Energy Company Ltd. for accurate analysis.
- Completely Customizable Template: Effortlessly adjust key inputs such as revenue growth, WACC, and EBITDA %.
- Instant Calculations: Witness real-time updates to Top Energy Company Ltd.'s intrinsic value as you make adjustments.
- Expert Valuation Tool: Tailored for investors, analysts, and consultants in pursuit of precise DCF evaluations.
- User-Friendly Interface: Intuitive layout and straightforward guidelines suitable for all skill levels.
Key Features
- Comprehensive DCF Calculator: Features detailed unlevered and levered DCF valuation models tailored for Top Energy Company Ltd. (600780SS).
- WACC Calculator: Comes with a pre-configured Weighted Average Cost of Capital sheet that allows for custom inputs.
- Customizable Forecast Assumptions: Easily adjust growth rates, capital expenditures, and discount rates to fit your analysis.
- Integrated Financial Ratios: Evaluate profitability, leverage, and efficiency ratios specifically for Top Energy Company Ltd. (600780SS).
- Interactive Dashboard and Charts: Visual summaries of essential valuation metrics simplify the analysis process.
How It Operates
- Step 1: Download the ready-to-use Excel template featuring data for Top Energy Company Ltd. (600780SS).
- Step 2: Review the pre-populated sheets to familiarize yourself with essential metrics.
- Step 3: Modify forecasts and assumptions in the editable yellow cells (WACC, growth, margins).
- Step 4: Instantly access updated results, including the intrinsic value of Top Energy Company Ltd. (600780SS).
- Step 5: Utilize the output data to make well-informed investment choices or create detailed reports.
Why Opt for This Calculator?
- User-Friendly: Ideal for both novices and seasoned users.
- Customizable Inputs: Effortlessly adjust variables to suit your analysis.
- Real-Time Updates: Observe instantaneous changes in Top Energy Company Ltd. (600780SS) valuation as you modify inputs.
- Preloaded Data: Comes equipped with Top Energy Company Ltd.'s actual financial information for swift assessments.
- Relied Upon by Experts: Employed by investors and analysts for well-informed decision-making.
Who Can Benefit from This Product?
- Investors: Effectively assess the fair value of Top Energy Company Ltd. (600780SS) prior to making investment choices.
- CFOs: Utilize a premium DCF model for comprehensive financial analysis and reporting.
- Consultants: Modify the template swiftly for client valuation reports.
- Entrepreneurs: Acquire valuable insights into the financial modeling practices of leading energy firms.
- Educators: Employ it as a resource for teaching valuation techniques and methods.
Contents of the Template
- Pre-Filled Data: Features historical financials and forecasts for Top Energy Company Ltd. (600780SS).
- Discounted Cash Flow Model: An editable DCF valuation model complete with automatic calculations.
- Weighted Average Cost of Capital (WACC): A dedicated sheet for calculating WACC using your custom inputs.
- Key Financial Ratios: Assess Top Energy Company Ltd.'s (600780SS) profitability, efficiency, and leverage.
- Customizable Inputs: Easily modify revenue growth, profit margins, and tax rates.
- Clear Dashboard: Visual charts and tables summarizing essential valuation outcomes.
Disclaimer
All information, articles, and product details provided on this website are for general informational and educational purposes only. We do not claim any ownership over, nor do we intend to infringe upon, any trademarks, copyrights, logos, brand names, or other intellectual property mentioned or depicted on this site. Such intellectual property remains the property of its respective owners, and any references here are made solely for identification or informational purposes, without implying any affiliation, endorsement, or partnership.
We make no representations or warranties, express or implied, regarding the accuracy, completeness, or suitability of any content or products presented. Nothing on this website should be construed as legal, tax, investment, financial, medical, or other professional advice. In addition, no part of this site—including articles or product references—constitutes a solicitation, recommendation, endorsement, advertisement, or offer to buy or sell any securities, franchises, or other financial instruments, particularly in jurisdictions where such activity would be unlawful.
All content is of a general nature and may not address the specific circumstances of any individual or entity. It is not a substitute for professional advice or services. Any actions you take based on the information provided here are strictly at your own risk. You accept full responsibility for any decisions or outcomes arising from your use of this website and agree to release us from any liability in connection with your use of, or reliance upon, the content or products found herein.