
|
Ikd Co., Ltd. (600933.SS) DCF -Bewertung |
Fully Editable: Tailor To Your Needs In Excel Or Sheets
Professional Design: Trusted, Industry-Standard Templates
Investor-Approved Valuation Models
MAC/PC Compatible, Fully Unlocked
No Expertise Is Needed; Easy To Follow
IKD Co., Ltd. (600933.SS) Bundle
Unser (600933S) DCF-Taschenrechner wurde für die Genauigkeit entwickelt und Sie ermöglicht die Bewertung der Bewertung von IKD Co., Ltd. unter Verwendung realer Finanzdaten und bieten gleichzeitig eine vollständige Flexibilität, um alle wesentlichen Parameter für erweiterte Projektionen zu ändern.
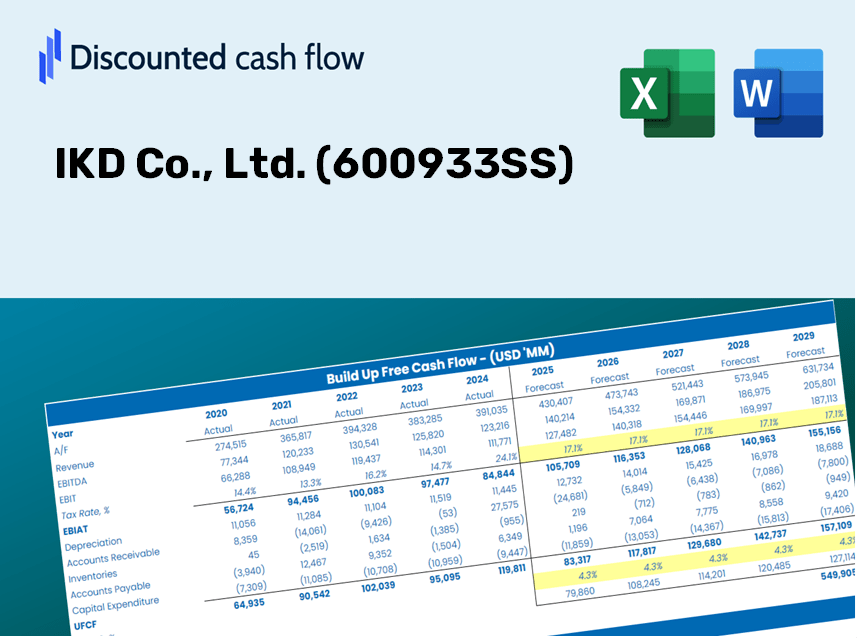
Discounted Cash Flow (DCF) - (USD MM)
| Year | AY1 2020 |
AY2 2021 |
AY3 2022 |
AY4 2023 |
AY5 2024 |
FY1 2025 |
FY2 2026 |
FY3 2027 |
FY4 2028 |
FY5 2029 |
|---|---|---|---|---|---|---|---|---|---|---|
| Revenue | 2,590.5 | 3,205.7 | 4,265.2 | 5,957.3 | 6,746.0 | 8,596.3 | 10,954.1 | 13,958.6 | 17,787.1 | 22,665.7 |
| Revenue Growth, % | 0 | 23.75 | 33.05 | 39.67 | 13.24 | 27.43 | 27.43 | 27.43 | 27.43 | 27.43 |
| EBITDA | 659.8 | 650.0 | 975.0 | 1,424.6 | 1,639.5 | 2,008.5 | 2,559.4 | 3,261.3 | 4,155.8 | 5,295.7 |
| EBITDA, % | 25.47 | 20.28 | 22.86 | 23.91 | 24.3 | 23.36 | 23.36 | 23.36 | 23.36 | 23.36 |
| Depreciation | 274.4 | 305.2 | 362.5 | 465.6 | 591.0 | 776.9 | 990.0 | 1,261.5 | 1,607.5 | 2,048.4 |
| Depreciation, % | 10.59 | 9.52 | 8.5 | 7.82 | 8.76 | 9.04 | 9.04 | 9.04 | 9.04 | 9.04 |
| EBIT | 385.4 | 344.8 | 612.5 | 959.0 | 1,048.5 | 1,231.6 | 1,569.4 | 1,999.8 | 2,548.3 | 3,247.3 |
| EBIT, % | 14.88 | 10.76 | 14.36 | 16.1 | 15.54 | 14.33 | 14.33 | 14.33 | 14.33 | 14.33 |
| Total Cash | 1,975.3 | 1,329.6 | 2,731.3 | 2,206.5 | 2,203.9 | 4,323.5 | 5,509.3 | 7,020.4 | 8,946.0 | 11,399.7 |
| Total Cash, percent | .0 | .0 | .0 | .0 | .0 | .0 | .0 | .0 | .0 | .0 |
| Account Receivables | 850.8 | 834.5 | 1,397.9 | 1,959.6 | 2,286.3 | 2,723.9 | 3,471.0 | 4,423.1 | 5,636.2 | 7,182.1 |
| Account Receivables, % | 32.84 | 26.03 | 32.77 | 32.89 | 33.89 | 31.69 | 31.69 | 31.69 | 31.69 | 31.69 |
| Inventories | 464.6 | 766.8 | 861.8 | 980.4 | 1,135.1 | 1,639.2 | 2,088.8 | 2,661.7 | 3,391.8 | 4,322.1 |
| Inventories, % | 17.93 | 23.92 | 20.2 | 16.46 | 16.83 | 19.07 | 19.07 | 19.07 | 19.07 | 19.07 |
| Accounts Payable | 295.3 | 175.4 | 292.1 | 594.3 | 818.5 | 787.9 | 1,004.0 | 1,279.4 | 1,630.3 | 2,077.5 |
| Accounts Payable, % | 11.4 | 5.47 | 6.85 | 9.98 | 12.13 | 9.17 | 9.17 | 9.17 | 9.17 | 9.17 |
| Capital Expenditure | -487.4 | -1,083.5 | -1,374.1 | -1,872.8 | -1,396.0 | -2,354.8 | -3,000.6 | -3,823.6 | -4,872.4 | -6,208.8 |
| Capital Expenditure, % | -18.82 | -33.8 | -32.22 | -31.44 | -20.69 | -27.39 | -27.39 | -27.39 | -27.39 | -27.39 |
| Tax Rate, % | 13.91 | 13.91 | 13.91 | 13.91 | 13.91 | 13.91 | 13.91 | 13.91 | 13.91 | 13.91 |
| EBITAT | 334.8 | 306.3 | 535.2 | 822.7 | 902.7 | 1,071.3 | 1,365.2 | 1,739.6 | 2,216.8 | 2,824.8 |
| Depreciation | ||||||||||
| Changes in Account Receivables | ||||||||||
| Changes in Inventories | ||||||||||
| Changes in Accounts Payable | ||||||||||
| Capital Expenditure | ||||||||||
| UFCF | -898.4 | -877.9 | -1,018.0 | -962.5 | -159.7 | -1,478.8 | -1,626.1 | -2,072.1 | -2,640.4 | -3,364.6 |
| WACC, % | 8.97 | 8.98 | 8.97 | 8.96 | 8.97 | 8.97 | 8.97 | 8.97 | 8.97 | 8.97 |
| PV UFCF | ||||||||||
| SUM PV UFCF | -8,390.2 | |||||||||
| Long Term Growth Rate, % | 4.00 | |||||||||
| Free cash flow (T + 1) | -3,499 | |||||||||
| Terminal Value | -70,409 | |||||||||
| Present Terminal Value | -45,824 | |||||||||
| Enterprise Value | -54,214 | |||||||||
| Net Debt | 1,920 | |||||||||
| Equity Value | -56,134 | |||||||||
| Diluted Shares Outstanding, MM | 989 | |||||||||
| Equity Value Per Share | -56.76 |
What You Will Receive
- Authentic IKD Data: Preloaded financials – encompassing everything from revenue to EBIT – based on real and projected numbers.
- Complete Customization: Modify all essential parameters (yellow cells) such as WACC, growth %, and tax rates.
- Immediate Valuation Updates: Automatic recalculations to assess the effects of changes on IKD’s fair value.
- Adaptable Excel Template: Designed for quick adjustments, scenario analysis, and in-depth projections.
- Efficient and Precise: Bypass the need to build models from scratch while preserving accuracy and flexibility.
Key Features
- Comprehensive DCF Calculator: Offers detailed unlevered and levered DCF valuation models tailored for IKD Co., Ltd. (600933SS).
- WACC Calculation Tool: Ready-to-use Weighted Average Cost of Capital template with adjustable inputs.
- Customizable Forecast Inputs: Easily update growth projections, capital expenditures, and discount rates.
- Integrated Financial Ratios: Assess profitability, leverage, and efficiency metrics specifically for IKD Co., Ltd. (600933SS).
- Interactive Dashboard and Charts: Visual representations of essential valuation metrics for streamlined analysis.
How It Works
- 1. Access the Template: Download and open the Excel file featuring IKD Co., Ltd.’s (600933SS) preloaded data.
- 2. Modify Assumptions: Adjust key parameters such as growth rates, WACC, and capital expenditures.
- 3. See Results Instantly: The DCF model automatically calculates the intrinsic value and NPV in real-time.
- 4. Explore Scenarios: Analyze different valuation outcomes by comparing various forecasts.
- 5. Present with Confidence: Share data-driven valuation insights to bolster your strategic decisions.
Why Opt for the IKD Co., Ltd. Calculator?
- Designed for Experts: A sophisticated tool favored by financial analysts, CFOs, and consultants.
- Comprehensive Data: IKD Co., Ltd.'s (600933SS) historical and projected financial information is preloaded for precision.
- Forecast Simulation: Effortlessly model various scenarios and assumptions.
- Detailed Results: Instantly calculates intrinsic value, NPV, and essential financial metrics.
- User-Friendly: Step-by-step guidance ensures a smooth experience throughout the process.
Who Can Benefit from This Product?
- Investors: Accurately assess the fair value of IKD Co., Ltd. (600933SS) before making investment choices.
- CFOs: Utilize a professional-grade DCF model for robust financial reporting and analysis.
- Consultants: Easily customize the template for client valuation reports.
- Entrepreneurs: Discover financial modeling techniques employed by leading companies.
- Educators: Leverage this as a teaching resource to illustrate valuation concepts.
Overview of the Template Components
- Preloaded IKD Co., Ltd. Data: Historical and projected financial figures, including revenue, EBIT, and capital expenditures.
- DCF and WACC Models: Professional sheets designed for calculating the intrinsic value and Weighted Average Cost of Capital.
- Editable Inputs: Yellow-highlighted cells for modifying revenue growth, tax rates, and discount rates.
- Financial Statements: Detailed annual and quarterly financial statements for in-depth analysis.
- Key Ratios: Ratios related to profitability, leverage, and efficiency to assess performance.
- Dashboard and Charts: Visual representation of valuation results and underlying assumptions.
Disclaimer
All information, articles, and product details provided on this website are for general informational and educational purposes only. We do not claim any ownership over, nor do we intend to infringe upon, any trademarks, copyrights, logos, brand names, or other intellectual property mentioned or depicted on this site. Such intellectual property remains the property of its respective owners, and any references here are made solely for identification or informational purposes, without implying any affiliation, endorsement, or partnership.
We make no representations or warranties, express or implied, regarding the accuracy, completeness, or suitability of any content or products presented. Nothing on this website should be construed as legal, tax, investment, financial, medical, or other professional advice. In addition, no part of this site—including articles or product references—constitutes a solicitation, recommendation, endorsement, advertisement, or offer to buy or sell any securities, franchises, or other financial instruments, particularly in jurisdictions where such activity would be unlawful.
All content is of a general nature and may not address the specific circumstances of any individual or entity. It is not a substitute for professional advice or services. Any actions you take based on the information provided here are strictly at your own risk. You accept full responsibility for any decisions or outcomes arising from your use of this website and agree to release us from any liability in connection with your use of, or reliance upon, the content or products found herein.