
|
Zhewen Interactive Group Co., Ltd. (600986.SS) DCF -Bewertung |
Fully Editable: Tailor To Your Needs In Excel Or Sheets
Professional Design: Trusted, Industry-Standard Templates
Investor-Approved Valuation Models
MAC/PC Compatible, Fully Unlocked
No Expertise Is Needed; Easy To Follow
Zhewen Interactive Group Co., Ltd. (600986.SS) Bundle
Vereinfachen Sie die Zhewen Interactive Group Co., Ltd. (600986S) Bewertung mit diesem anpassbaren DCF -Taschenrechner! Mit Real Zhewen Interactive Group Co., Ltd. (600986S) Finanzdaten und einstellbaren Prognoseeingängen können Sie Szenarien testen und Zhewen Interactive Group Co., Ltd. (600986S) beizulegen.
What You Will Receive
- Comprehensive Zhewen Financials: Access to detailed historical and projected data for precise valuation.
- Customizable Parameters: Adjust discount rates, tax percentages, revenue growth, and capital expenditures as needed.
- Automated Calculations: Intrinsic value and NPV are calculated in real-time.
- Scenario Analysis: Evaluate various scenarios to assess Zhewen's future performance.
- User-Friendly Interface: Designed for industry professionals while remaining easy for newcomers to navigate.
Key Features
- 🔍 Real-Life Zhewen Interactive Financials: Pre-filled historical and projected data for Zhewen Interactive Group Co., Ltd. (600986SS).
- ✏️ Fully Customizable Inputs: Modify all essential parameters (yellow cells) including WACC, growth %, and tax rates.
- 📊 Professional DCF Valuation: Integrated formulas calculate Zhewen's intrinsic value utilizing the Discounted Cash Flow method.
- ⚡ Instant Results: Immediately visualize Zhewen's valuation after any adjustments.
- Scenario Analysis: Examine and compare results for different financial assumptions side-by-side.
How It Functions
- 1. Access the Template: Download and launch the Excel file containing Zhewen Interactive Group Co., Ltd.'s (600986SS) preloaded data.
- 2. Modify Assumptions: Update essential inputs such as growth rates, WACC, and capital expenditures.
- 3. Instantly View Results: The DCF model automatically calculates the intrinsic value and NPV.
- 4. Experiment with Scenarios: Analyze various forecasts to evaluate different valuation results.
- 5. Utilize with Assurance: Present polished valuation analyses to back up your strategic decisions.
Why Opt for Our Calculator?
- All-in-One Solution: Combines DCF, WACC, and financial ratio assessments for a holistic analysis.
- Flexible Input Options: Modify the highlighted cells to explore different financial scenarios.
- In-Depth Analysis: Instantly calculates the intrinsic value and Net Present Value for Zhewen Interactive Group Co., Ltd. (600986SS).
- Integrated Data: Utilizes both historical and projected data for precise calculations.
- High-Quality Standards: Perfect for financial analysts, investors, and business consultants seeking reliable insights.
Who Can Benefit from Zhewen Interactive Group Co., Ltd. (600986SS)?
- Investors: Gain insights and make informed decisions with a top-tier valuation tool.
- Financial Analysts: Streamline your workflow with a customizable DCF model included.
- Consultants: Effortlessly modify the template for client proposals or analytical reports.
- Finance Enthusiasts: Enhance your grasp of valuation methods through practical examples.
- Educators and Students: Utilize this resource as a hands-on learning aid in finance studies.
Contents of the Template
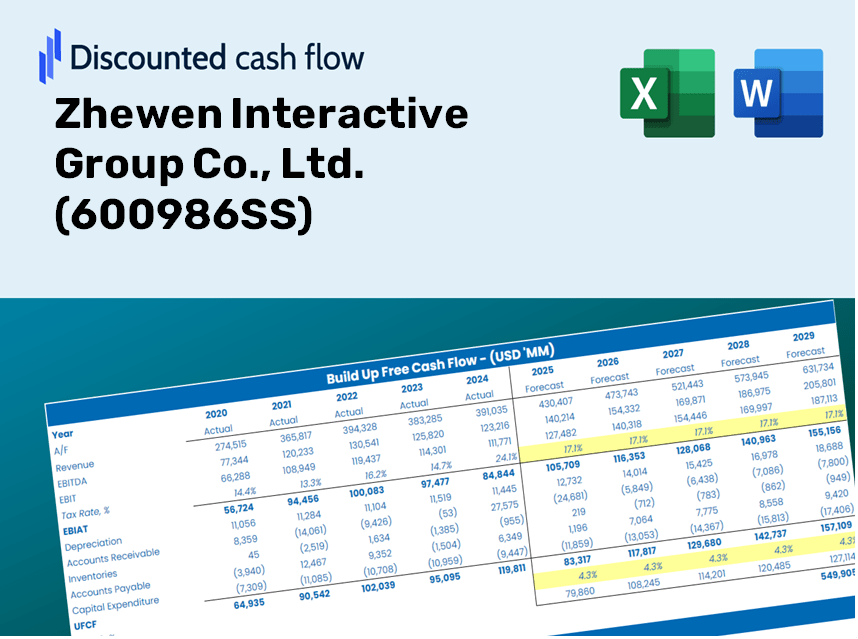
- Operating and Balance Sheet Data: Pre-filled historical data and projections for Zhewen Interactive Group Co., Ltd. (600986SS), including revenue, EBITDA, EBIT, and capital expenditures.
- WACC Calculation: A specific sheet dedicated to the Weighted Average Cost of Capital (WACC), featuring key parameters such as Beta, risk-free rate, and share price.
- DCF Valuation (Unlevered and Levered): Customizable Discounted Cash Flow models that display intrinsic value along with comprehensive calculations.
- Financial Statements: Pre-loaded annual and quarterly financial statements to facilitate thorough analysis.
- Key Ratios: A collection of profitability, leverage, and efficiency ratios pertinent to Zhewen Interactive Group Co., Ltd. (600986SS).
- Dashboard and Charts: A visual summary of valuation outputs and assumptions for straightforward analysis of results.
Disclaimer
All information, articles, and product details provided on this website are for general informational and educational purposes only. We do not claim any ownership over, nor do we intend to infringe upon, any trademarks, copyrights, logos, brand names, or other intellectual property mentioned or depicted on this site. Such intellectual property remains the property of its respective owners, and any references here are made solely for identification or informational purposes, without implying any affiliation, endorsement, or partnership.
We make no representations or warranties, express or implied, regarding the accuracy, completeness, or suitability of any content or products presented. Nothing on this website should be construed as legal, tax, investment, financial, medical, or other professional advice. In addition, no part of this site—including articles or product references—constitutes a solicitation, recommendation, endorsement, advertisement, or offer to buy or sell any securities, franchises, or other financial instruments, particularly in jurisdictions where such activity would be unlawful.
All content is of a general nature and may not address the specific circumstances of any individual or entity. It is not a substitute for professional advice or services. Any actions you take based on the information provided here are strictly at your own risk. You accept full responsibility for any decisions or outcomes arising from your use of this website and agree to release us from any liability in connection with your use of, or reliance upon, the content or products found herein.