
|
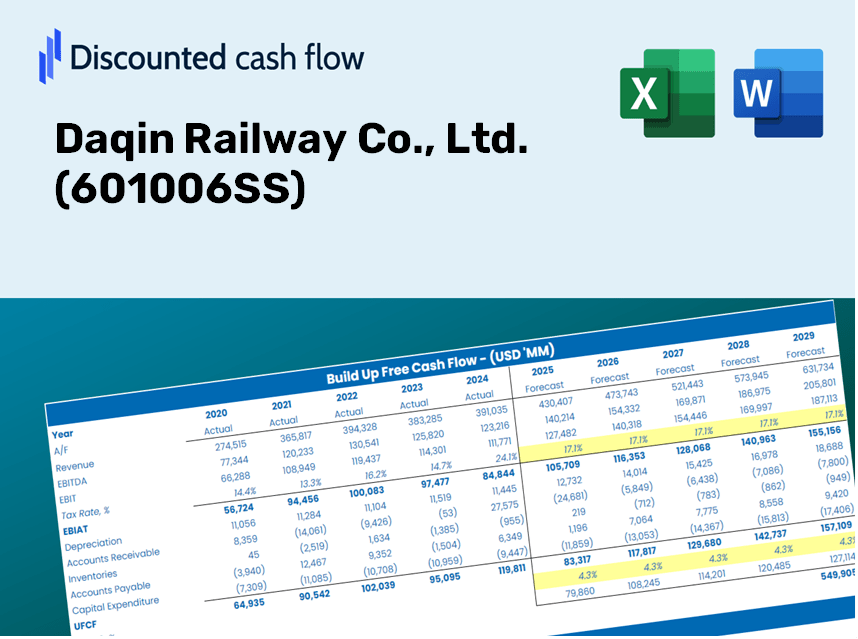
Daqin Railway Co., Ltd. (601006.SS) DCF -Bewertung |
Fully Editable: Tailor To Your Needs In Excel Or Sheets
Professional Design: Trusted, Industry-Standard Templates
Investor-Approved Valuation Models
MAC/PC Compatible, Fully Unlocked
No Expertise Is Needed; Easy To Follow
Daqin Railway Co., Ltd. (601006.SS) Bundle
Bewerten Sie den finanziellen Ausblick von Daqin Railway Co., Ltd. wie ein Profi! Dieser (601006SS) DCF-Taschenrechner verfügt über vorgefüllte Finanzdaten und ermöglicht Ihnen eine vollständige Flexibilität, um das Umsatzwachstum, WACC, Margen und andere kritische Annahmen zu ändern, um sich an Ihren Prognosen auszurichten.
What You Will Receive
- Authentic Daqin Railway Financial Data: Pre-loaded with historical and projected figures for in-depth analysis.
- Completely Customizable Template: Easily adjust vital inputs like revenue growth, WACC, and EBITDA percentage.
- Instant Calculations: Watch Daqin Railway’s intrinsic value update in real-time as you make modifications.
- Professional Valuation Tool: Perfect for investors, analysts, and consultants looking for precise DCF outcomes.
- User-Friendly Interface: Intuitive layout and clear instructions suitable for all levels of expertise.
Key Features
- Comprehensive Daqin Railway Financials: Gain access to precise pre-loaded historical data and future forecasts.
- Customizable Financial Inputs: Modify the highlighted cells for WACC, growth rates, and profit margins as needed.
- Real-time Calculations: Enjoy automatic updates for DCF, Net Present Value (NPV), and cash flow analysis.
- Interactive Dashboard: User-friendly charts and summaries to clearly visualize your valuation outcomes.
- Designed for All Skill Levels: An intuitive layout tailored for investors, CFOs, and consultants alike.
How It Works
- Step 1: Download the Excel file.
- Step 2: Examine the pre-loaded Daqin Railway data (historical and projected).
- Step 3: Modify key assumptions (highlighted in yellow) according to your analysis.
- Step 4: Observe automatic recalculations for Daqin Railway's intrinsic value.
- Step 5: Utilize the results for your investment decisions or reporting purposes.
Why Choose the Daqin Railway Calculator?
- Accurate Data: Up-to-date Daqin Railway financials guarantee trustworthy valuation outcomes.
- Customizable: Tailor essential parameters such as growth rates, WACC, and tax rates to fit your forecasts.
- Time-Saving: Built-in calculations allow you to avoid starting from scratch.
- Professional-Grade Tool: Crafted for investors, analysts, and consultants in the railway sector.
- User-Friendly: Simple layout and clear instructions ensure accessibility for all users.
Who Can Benefit from This Product?
- Investors: Assess Daqin Railway Co., Ltd.'s ([601006SS]) valuation prior to making investment decisions.
- CFOs and Financial Analysts: Enhance valuation methodologies and evaluate financial forecasts.
- Startup Founders: Discover how established companies like Daqin Railway ([601006SS]) are valued in the market.
- Consultants: Create comprehensive valuation reports for your clients using insights from Daqin Railway ([601006SS]).
- Students and Educators: Utilize practical data to learn and teach valuation skills effectively.
What the Template Includes
- Pre-Filled DCF Model: Daqin Railway’s financial data preloaded for immediate application.
- WACC Calculator: In-depth calculations for the Weighted Average Cost of Capital.
- Financial Ratios: Analyze Daqin Railway’s profitability, leverage, and operational efficiency.
- Editable Inputs: Modify assumptions such as growth rates, profit margins, and CAPEX to suit your scenarios.
- Financial Statements: Comprehensive annual and quarterly reports for in-depth analysis.
- Interactive Dashboard: Effortlessly visualize key valuation metrics and outcomes.
Disclaimer
All information, articles, and product details provided on this website are for general informational and educational purposes only. We do not claim any ownership over, nor do we intend to infringe upon, any trademarks, copyrights, logos, brand names, or other intellectual property mentioned or depicted on this site. Such intellectual property remains the property of its respective owners, and any references here are made solely for identification or informational purposes, without implying any affiliation, endorsement, or partnership.
We make no representations or warranties, express or implied, regarding the accuracy, completeness, or suitability of any content or products presented. Nothing on this website should be construed as legal, tax, investment, financial, medical, or other professional advice. In addition, no part of this site—including articles or product references—constitutes a solicitation, recommendation, endorsement, advertisement, or offer to buy or sell any securities, franchises, or other financial instruments, particularly in jurisdictions where such activity would be unlawful.
All content is of a general nature and may not address the specific circumstances of any individual or entity. It is not a substitute for professional advice or services. Any actions you take based on the information provided here are strictly at your own risk. You accept full responsibility for any decisions or outcomes arising from your use of this website and agree to release us from any liability in connection with your use of, or reliance upon, the content or products found herein.