
|
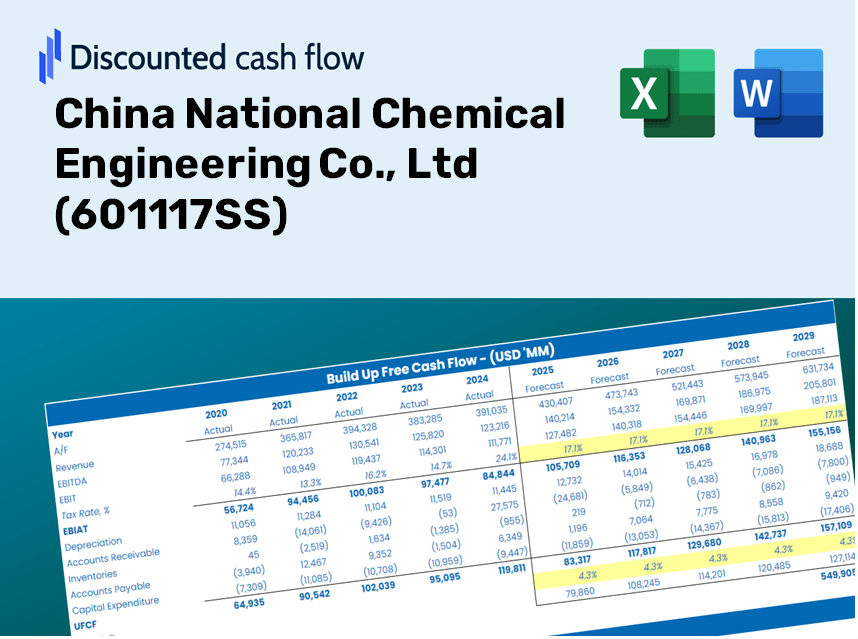
China National Chemical Engineering Co., Ltd (601117.SS) DCF -Bewertung |
Fully Editable: Tailor To Your Needs In Excel Or Sheets
Professional Design: Trusted, Industry-Standard Templates
Investor-Approved Valuation Models
MAC/PC Compatible, Fully Unlocked
No Expertise Is Needed; Easy To Follow
China National Chemical Engineering Co., Ltd (601117.SS) Bundle
Möchten Sie den inneren Wert der China National Chemical Engineering Co., Ltd. ermitteln? Unser (601117SS) DCF-Taschenrechner integriert reale Daten und bietet umfangreiche Anpassungsoptionen, sodass Sie Ihre Prognosen verfeinern und fundiertere Investitionsentscheidungen treffen können.
Discounted Cash Flow (DCF) - (USD MM)
| Year | AY1 2020 |
AY2 2021 |
AY3 2022 |
AY4 2023 |
AY5 2024 |
FY1 2025 |
FY2 2026 |
FY3 2027 |
FY4 2028 |
FY5 2029 |
|---|---|---|---|---|---|---|---|---|---|---|
| Revenue | 109,459.4 | 137,292.7 | 157,722.1 | 178,367.3 | 185,847.9 | 191,989.9 | 198,334.9 | 204,889.6 | 211,660.9 | 218,656.0 |
| Revenue Growth, % | 0 | 25.43 | 14.88 | 13.09 | 4.19 | 3.3 | 3.3 | 3.3 | 3.3 | 3.3 |
| EBITDA | 5,974.1 | 5,878.2 | 6,890.6 | 7,747.5 | 8,556.4 | 8,852.9 | 9,145.5 | 9,447.7 | 9,760.0 | 10,082.5 |
| EBITDA, % | 5.46 | 4.28 | 4.37 | 4.34 | 4.6 | 4.61 | 4.61 | 4.61 | 4.61 | 4.61 |
| Depreciation | 1,134.5 | 1,160.9 | 1,282.0 | 1,422.4 | 1,456.6 | 1,641.9 | 1,696.2 | 1,752.2 | 1,810.2 | 1,870.0 |
| Depreciation, % | 1.04 | 0.84559 | 0.81281 | 0.79746 | 0.78377 | 0.85521 | 0.85521 | 0.85521 | 0.85521 | 0.85521 |
| EBIT | 4,839.7 | 4,717.2 | 5,608.6 | 6,325.1 | 7,099.8 | 7,211.0 | 7,449.3 | 7,695.5 | 7,949.8 | 8,212.6 |
| EBIT, % | 4.42 | 3.44 | 3.56 | 3.55 | 3.82 | 3.76 | 3.76 | 3.76 | 3.76 | 3.76 |
| Total Cash | 39,164.1 | 45,482.3 | 43,187.1 | 51,585.6 | 51,251.2 | 58,667.2 | 60,606.1 | 62,609.0 | 64,678.2 | 66,815.7 |
| Total Cash, percent | .0 | .0 | .0 | .0 | .0 | .0 | .0 | .0 | .0 | .0 |
| Account Receivables | 54,341.5 | 71,754.9 | 79,154.4 | 84,259.7 | 94,066.4 | 95,975.6 | 99,147.5 | 102,424.2 | 105,809.2 | 109,306.0 |
| Account Receivables, % | 49.65 | 52.26 | 50.19 | 47.24 | 50.61 | 49.99 | 49.99 | 49.99 | 49.99 | 49.99 |
| Inventories | 4,201.2 | 5,219.4 | 6,190.9 | 5,511.6 | 5,848.5 | 6,835.6 | 7,061.5 | 7,294.9 | 7,535.9 | 7,785.0 |
| Inventories, % | 3.84 | 3.8 | 3.93 | 3.09 | 3.15 | 3.56 | 3.56 | 3.56 | 3.56 | 3.56 |
| Accounts Payable | 48,816.6 | 63,340.4 | 51,037.7 | 75,995.5 | 100,837.7 | 84,459.0 | 87,250.2 | 90,133.7 | 93,112.5 | 96,189.8 |
| Accounts Payable, % | 44.6 | 46.14 | 32.36 | 42.61 | 54.26 | 43.99 | 43.99 | 43.99 | 43.99 | 43.99 |
| Capital Expenditure | -877.6 | -3,831.8 | -3,041.4 | -3,334.4 | -3,020.0 | -3,461.7 | -3,576.2 | -3,694.3 | -3,816.4 | -3,942.6 |
| Capital Expenditure, % | -0.80174 | -2.79 | -1.93 | -1.87 | -1.62 | -1.8 | -1.8 | -1.8 | -1.8 | -1.8 |
| Tax Rate, % | 22.71 | 22.71 | 22.71 | 22.71 | 22.71 | 22.71 | 22.71 | 22.71 | 22.71 | 22.71 |
| EBITAT | 3,897.0 | 3,617.9 | 4,530.0 | 4,970.1 | 5,487.4 | 5,680.2 | 5,867.9 | 6,061.8 | 6,262.1 | 6,469.1 |
| Depreciation | ||||||||||
| Changes in Account Receivables | ||||||||||
| Changes in Inventories | ||||||||||
| Changes in Accounts Payable | ||||||||||
| Capital Expenditure | ||||||||||
| UFCF | -5,572.2 | -2,960.8 | -17,903.0 | 23,589.9 | 18,622.6 | -15,414.7 | 3,381.4 | 3,493.2 | 3,608.6 | 3,727.9 |
| WACC, % | 6.56 | 6.52 | 6.56 | 6.54 | 6.53 | 6.54 | 6.54 | 6.54 | 6.54 | 6.54 |
| PV UFCF | ||||||||||
| SUM PV UFCF | -3,084.9 | |||||||||
| Long Term Growth Rate, % | 0.50 | |||||||||
| Free cash flow (T + 1) | 3,746 | |||||||||
| Terminal Value | 62,001 | |||||||||
| Present Terminal Value | 45,163 | |||||||||
| Enterprise Value | 42,078 | |||||||||
| Net Debt | -38,089 | |||||||||
| Equity Value | 80,167 | |||||||||
| Diluted Shares Outstanding, MM | 6,116 | |||||||||
| Equity Value Per Share | 13.11 |
What You Will Receive
- Authentic CNCEC Financials: Access to historical and projected data for precise valuation.
- Customizable Inputs: Adjust WACC, tax rates, revenue growth, and capital expenditures as needed.
- Automated Calculations: Dynamic calculations for intrinsic value and NPV.
- Scenario Analysis: Explore various scenarios to assess the future performance of China National Chemical Engineering Co., Ltd (601117SS).
- User-Friendly Interface: Designed for industry professionals but approachable for newcomers.
Key Features
- Comprehensive Data: Access China National Chemical Engineering Co., Ltd's historical financial statements and pre-populated forecasts.
- Customizable Parameters: Adjust WACC, tax rates, revenue growth, and EBITDA margins to fit your analysis.
- Real-Time Insights: Watch the intrinsic value of China National Chemical Engineering Co., Ltd (601117SS) update live.
- Intuitive Visualizations: Dashboard charts present valuation outcomes and essential metrics clearly.
- Engineered for Precision: A robust tool tailored for analysts, investors, and financial professionals.
How It Functions
- Download: Obtain the ready-to-use Excel file containing China National Chemical Engineering Co., Ltd's (601117SS) financial data.
- Customize: Modify projections such as revenue growth, EBITDA %, and WACC according to your needs.
- Automatic Updates: Watch as intrinsic value and NPV calculations refresh in real-time.
- Scenario Testing: Generate various projections and instantly compare the results.
- Informed Decisions: Leverage the valuation insights to shape your investment approach.
Why Opt for This Calculator?
- Designed for Experts: A sophisticated tool favored by analysts, CFOs, and industry consultants.
- Accurate Financial Data: China National Chemical Engineering Co., Ltd's (601117SS) historical and projected financial information is preloaded for precision.
- Scenario Analysis: Effortlessly simulate various forecasts and assumptions.
- Concise Results: Instantly calculates intrinsic value, NPV, and essential financial metrics.
- User-Friendly: Step-by-step guidance walks you through every aspect of the process.
Who Can Benefit from This Product?
- Investors: Evaluate China National Chemical Engineering Co., Ltd's (601117SS) market valuation prior to making investment decisions.
- CFOs and Financial Analysts: Optimize valuation methodologies and assess financial forecasts.
- Startup Founders: Understand how established companies like China National Chemical Engineering Co., Ltd (601117SS) are valued in the market.
- Consultants: Provide expert valuation analysis and reports for your clientele.
- Students and Educators: Utilize real-time data for hands-on practice and instruction in valuation concepts.
What the Template Includes
- Pre-Filled Data: Contains China National Chemical Engineering Co., Ltd's historical financial statements and projections.
- Discounted Cash Flow Model: An editable DCF valuation model with automatic calculations for ease of use.
- Weighted Average Cost of Capital (WACC): A specific sheet for computing WACC based on your custom inputs.
- Key Financial Ratios: Evaluate profitability, efficiency, and leverage metrics for China National Chemical Engineering Co., Ltd (601117SS).
- Customizable Inputs: Easily modify revenue growth, profit margins, and tax rates as needed.
- Comprehensive Dashboard: Visuals and tables that summarize critical valuation outcomes.
Disclaimer
All information, articles, and product details provided on this website are for general informational and educational purposes only. We do not claim any ownership over, nor do we intend to infringe upon, any trademarks, copyrights, logos, brand names, or other intellectual property mentioned or depicted on this site. Such intellectual property remains the property of its respective owners, and any references here are made solely for identification or informational purposes, without implying any affiliation, endorsement, or partnership.
We make no representations or warranties, express or implied, regarding the accuracy, completeness, or suitability of any content or products presented. Nothing on this website should be construed as legal, tax, investment, financial, medical, or other professional advice. In addition, no part of this site—including articles or product references—constitutes a solicitation, recommendation, endorsement, advertisement, or offer to buy or sell any securities, franchises, or other financial instruments, particularly in jurisdictions where such activity would be unlawful.
All content is of a general nature and may not address the specific circumstances of any individual or entity. It is not a substitute for professional advice or services. Any actions you take based on the information provided here are strictly at your own risk. You accept full responsibility for any decisions or outcomes arising from your use of this website and agree to release us from any liability in connection with your use of, or reliance upon, the content or products found herein.