
|
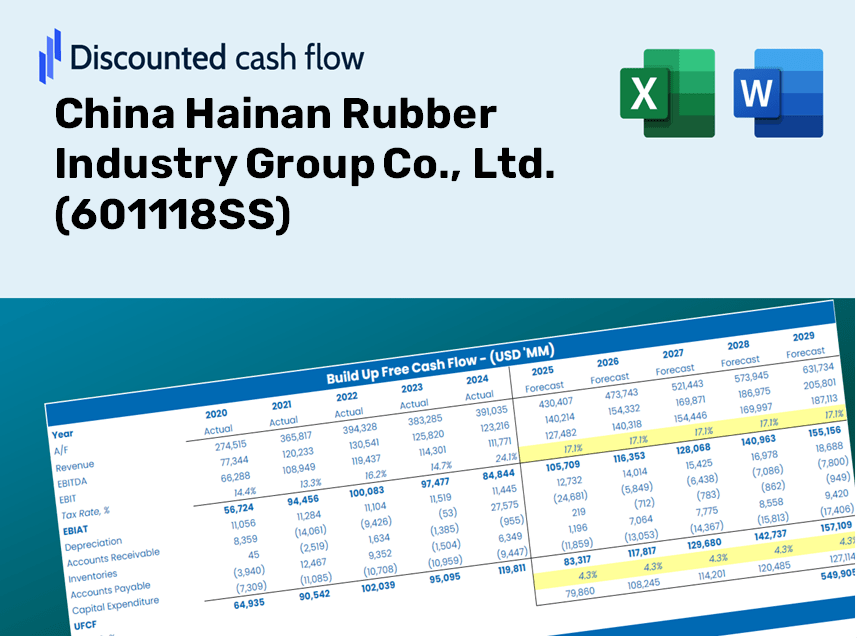
China Hainan Rubber Industry Group Co., Ltd. (601118.SS) DCF -Bewertung |
Fully Editable: Tailor To Your Needs In Excel Or Sheets
Professional Design: Trusted, Industry-Standard Templates
Investor-Approved Valuation Models
MAC/PC Compatible, Fully Unlocked
No Expertise Is Needed; Easy To Follow
China Hainan Rubber Industry Group Co., Ltd. (601118.SS) Bundle
Optimieren Sie Ihre Zeit und verbessern Sie die Präzision mit unserem DCF -Taschenrechner (601118S)! Mit tatsächlichen Daten der China Hainan Rubber Industry Group Co., Ltd. und anpassbaren Annahmen ermöglichen dieses Tool Sie, wie ein erfahrener Investor prognostiziert, analysieren und value (601118SS).
Discounted Cash Flow (DCF) - (USD MM)
| Year | AY1 2020 |
AY2 2021 |
AY3 2022 |
AY4 2023 |
AY5 2024 |
FY1 2025 |
FY2 2026 |
FY3 2027 |
FY4 2028 |
FY5 2029 |
|---|---|---|---|---|---|---|---|---|---|---|
| Revenue | 15,744.3 | 15,332.7 | 15,371.3 | 37,687.3 | 49,672.6 | 65,746.6 | 87,022.1 | 115,182.2 | 152,455.0 | 201,789.2 |
| Revenue Growth, % | 0 | -2.61 | 0.25124 | 145.18 | 31.8 | 32.36 | 32.36 | 32.36 | 32.36 | 32.36 |
| EBITDA | 376.9 | 312.7 | -13.0 | 246.8 | 918.4 | 901.1 | 1,192.7 | 1,578.7 | 2,089.5 | 2,765.7 |
| EBITDA, % | 2.39 | 2.04 | -0.08443332 | 0.65493 | 1.85 | 1.37 | 1.37 | 1.37 | 1.37 | 1.37 |
| Depreciation | 273.3 | 374.6 | 332.4 | 763.2 | 630.4 | 1,267.1 | 1,677.1 | 2,219.8 | 2,938.1 | 3,888.9 |
| Depreciation, % | 1.74 | 2.44 | 2.16 | 2.03 | 1.27 | 1.93 | 1.93 | 1.93 | 1.93 | 1.93 |
| EBIT | 103.6 | -61.9 | -345.4 | -516.3 | 288.0 | -366.0 | -484.4 | -641.1 | -848.6 | -1,123.2 |
| EBIT, % | 0.65784 | -0.40371 | -2.25 | -1.37 | 0.5798 | -0.55661 | -0.55661 | -0.55661 | -0.55661 | -0.55661 |
| Total Cash | 3,684.5 | 2,988.7 | 5,680.4 | 3,505.7 | 5,687.6 | 13,228.4 | 17,509.1 | 23,175.0 | 30,674.4 | 40,600.6 |
| Total Cash, percent | .0 | .0 | .0 | .0 | .0 | .0 | .0 | .0 | .0 | .0 |
| Account Receivables | 1,012.8 | 1,483.3 | 813.6 | 1,888.9 | 3,154.5 | 4,308.0 | 5,702.1 | 7,547.3 | 9,989.6 | 13,222.2 |
| Account Receivables, % | 6.43 | 9.67 | 5.29 | 5.01 | 6.35 | 6.55 | 6.55 | 6.55 | 6.55 | 6.55 |
| Inventories | 1,463.4 | 1,508.4 | 1,740.7 | 4,525.8 | 5,224.5 | 6,966.9 | 9,221.4 | 12,205.5 | 16,155.1 | 21,382.9 |
| Inventories, % | 9.29 | 9.84 | 11.32 | 12.01 | 10.52 | 10.6 | 10.6 | 10.6 | 10.6 | 10.6 |
| Accounts Payable | 668.0 | 527.9 | 693.3 | 1,120.1 | 1,436.4 | 2,374.7 | 3,143.2 | 4,160.3 | 5,506.6 | 7,288.5 |
| Accounts Payable, % | 4.24 | 3.44 | 4.51 | 2.97 | 2.89 | 3.61 | 3.61 | 3.61 | 3.61 | 3.61 |
| Capital Expenditure | -788.3 | -619.2 | -1,000.6 | -993.6 | -871.2 | -2,622.6 | -3,471.3 | -4,594.6 | -6,081.3 | -8,049.3 |
| Capital Expenditure, % | -5.01 | -4.04 | -6.51 | -2.64 | -1.75 | -3.99 | -3.99 | -3.99 | -3.99 | -3.99 |
| Tax Rate, % | 23.46 | 23.46 | 23.46 | 23.46 | 23.46 | 23.46 | 23.46 | 23.46 | 23.46 | 23.46 |
| EBITAT | 78.6 | -70.5 | -322.6 | -478.5 | 220.4 | -321.0 | -424.8 | -562.3 | -744.2 | -985.1 |
| Depreciation | ||||||||||
| Changes in Account Receivables | ||||||||||
| Changes in Inventories | ||||||||||
| Changes in Accounts Payable | ||||||||||
| Capital Expenditure | ||||||||||
| UFCF | -2,244.5 | -970.7 | -387.9 | -4,142.5 | -1,668.5 | -3,634.1 | -5,099.1 | -6,749.2 | -8,933.2 | -11,823.9 |
| WACC, % | 5.36 | 5.8 | 5.68 | 5.67 | 5.37 | 5.58 | 5.58 | 5.58 | 5.58 | 5.58 |
| PV UFCF | ||||||||||
| SUM PV UFCF | -29,954.5 | |||||||||
| Long Term Growth Rate, % | 2.00 | |||||||||
| Free cash flow (T + 1) | -12,060 | |||||||||
| Terminal Value | -337,032 | |||||||||
| Present Terminal Value | -256,918 | |||||||||
| Enterprise Value | -286,873 | |||||||||
| Net Debt | 9,943 | |||||||||
| Equity Value | -296,815 | |||||||||
| Diluted Shares Outstanding, MM | 4,272 | |||||||||
| Equity Value Per Share | -69.47 |
Benefits You Will Receive
- Pre-Filled Financial Model: Leverage China Hainan Rubber Industry Group Co., Ltd.'s actual data for accurate DCF valuation.
- Comprehensive Forecast Control: Modify key drivers like revenue growth, profit margins, WACC, and more.
- Real-Time Calculations: Automatic updates let you see immediate results as you adjust inputs.
- Professional-Grade Template: A polished Excel file crafted for serious investment analysis.
- Flexible and Reusable: Designed for customization, allowing for repeated use in detailed forecasting.
Key Features
- 🔍 Real-Life Hainan Rubber Financials: Pre-filled historical and forecasted data for China Hainan Rubber Industry Group Co., Ltd. (601118SS).
- ✏️ Fully Customizable Inputs: Modify all essential parameters (yellow cells) such as WACC, growth %, and tax rates.
- 📊 Professional DCF Valuation: Integrated formulas compute the intrinsic value of Hainan Rubber using the Discounted Cash Flow approach.
- ⚡ Instant Results: Immediately visualize Hainan Rubber’s valuation after making adjustments.
- Scenario Analysis: Evaluate and compare financial outcomes based on different assumptions side-by-side.
How It Works
- Step 1: Download the Excel file for China Hainan Rubber Industry Group Co., Ltd. (601118SS).
- Step 2: Review the pre-filled financial data and projections specific to China Hainan Rubber.
- Step 3: Adjust key inputs such as revenue growth, WACC, and tax rates (highlighted cells).
- Step 4: Observe the DCF model update in real-time as you modify your assumptions.
- Step 5: Examine the outputs and utilize the results to inform your investment choices.
Why Choose This Calculator?
- Designed for Experts: A sophisticated tool tailored for analysts, CFOs, and consultants handling (601118SS).
- Comprehensive Data: Hainan Rubber's historical and projected financials are preloaded for precise analysis.
- Flexible Scenario Testing: Easily run simulations with various forecasts and assumptions.
- Instant Results: Automatically computes intrinsic value, NPV, and essential financial metrics.
- User-Friendly: Step-by-step guidance ensures a smooth experience throughout the process.
Who Should Utilize This Product?
- Investors: Assess the valuation of China Hainan Rubber Industry Group Co., Ltd. (601118SS) prior to making investment decisions.
- CFOs and Financial Analysts: Enhance valuation methodologies and validate financial projections.
- Startup Founders: Discover how large public companies, like China Hainan Rubber Industry Group Co., Ltd. (601118SS), are valued in the market.
- Consultants: Create comprehensive valuation reports for your clientele.
- Students and Educators: Utilize real-world data to practice and educate on valuation strategies.
What the Template Contains
- Pre-Filled Data: Features China Hainan Rubber Industry Group Co., Ltd.'s (601118SS) historical financials and projections.
- Discounted Cash Flow Model: Editable DCF valuation model with automated calculations.
- Weighted Average Cost of Capital (WACC): A dedicated sheet for WACC calculation based on customized inputs.
- Key Financial Ratios: Evaluate China Hainan Rubber Industry Group Co., Ltd.'s (601118SS) profitability, efficiency, and leverage.
- Customizable Inputs: Easily adjust revenue growth, profit margins, and tax rates.
- Clear Dashboard: Visual charts and tables summarizing essential valuation outcomes.
Disclaimer
All information, articles, and product details provided on this website are for general informational and educational purposes only. We do not claim any ownership over, nor do we intend to infringe upon, any trademarks, copyrights, logos, brand names, or other intellectual property mentioned or depicted on this site. Such intellectual property remains the property of its respective owners, and any references here are made solely for identification or informational purposes, without implying any affiliation, endorsement, or partnership.
We make no representations or warranties, express or implied, regarding the accuracy, completeness, or suitability of any content or products presented. Nothing on this website should be construed as legal, tax, investment, financial, medical, or other professional advice. In addition, no part of this site—including articles or product references—constitutes a solicitation, recommendation, endorsement, advertisement, or offer to buy or sell any securities, franchises, or other financial instruments, particularly in jurisdictions where such activity would be unlawful.
All content is of a general nature and may not address the specific circumstances of any individual or entity. It is not a substitute for professional advice or services. Any actions you take based on the information provided here are strictly at your own risk. You accept full responsibility for any decisions or outcomes arising from your use of this website and agree to release us from any liability in connection with your use of, or reliance upon, the content or products found herein.