
|
Seres Group Co., Ltd. (601127.SS) DCF -Bewertung |
Fully Editable: Tailor To Your Needs In Excel Or Sheets
Professional Design: Trusted, Industry-Standard Templates
Investor-Approved Valuation Models
MAC/PC Compatible, Fully Unlocked
No Expertise Is Needed; Easy To Follow
Seres Group Co.,Ltd. (601127.SS) Bundle
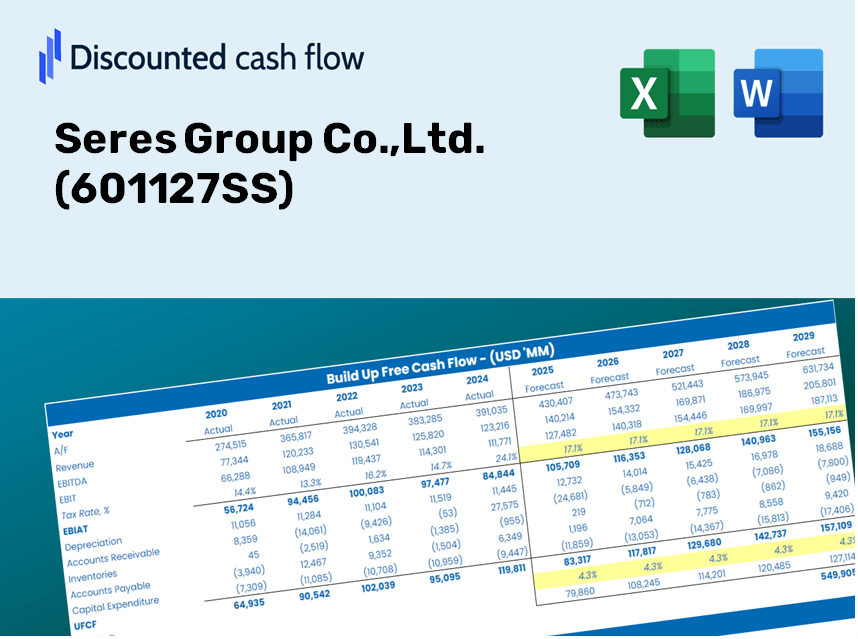
Entdecken Sie das finanzielle Potenzial von Seres Group Co., Ltd. (601127SS) mit unserem benutzerfreundlichen DCF-Taschenrechner! Geben Sie Ihre Prognosen für Wachstum, Margen und Kosten ein, um den inneren Wert von Seren Group Co., Ltd. (601127SS) zu berechnen und Ihren Investitionsansatz zu verfeinern.
Discounted Cash Flow (DCF) - (USD MM)
| Year | AY1 2020 |
AY2 2021 |
AY3 2022 |
AY4 2023 |
AY5 2024 |
FY1 2025 |
FY2 2026 |
FY3 2027 |
FY4 2028 |
FY5 2029 |
|---|---|---|---|---|---|---|---|---|---|---|
| Revenue | 14,302.5 | 16,717.9 | 34,105.0 | 35,842.0 | 145,175.8 | 225,741.6 | 351,017.6 | 545,816.0 | 848,718.4 | 1,319,717.3 |
| Revenue Growth, % | 0 | 16.89 | 104 | 5.09 | 305.04 | 55.5 | 55.5 | 55.5 | 55.5 | 55.5 |
| EBITDA | -369.0 | -1,621.3 | -3,120.8 | -3,824.0 | 9,843.6 | -11,430.2 | -17,773.4 | -27,636.8 | -42,973.9 | -66,822.5 |
| EBITDA, % | -2.58 | -9.7 | -9.15 | -10.67 | 6.78 | -5.06 | -5.06 | -5.06 | -5.06 | -5.06 |
| Depreciation | 1,333.4 | 1,621.7 | 2,163.7 | 2,504.6 | 3,736.4 | 15,769.9 | 24,521.4 | 38,129.7 | 59,289.8 | 92,192.9 |
| Depreciation, % | 9.32 | 9.7 | 6.34 | 6.99 | 2.57 | 6.99 | 6.99 | 6.99 | 6.99 | 6.99 |
| EBIT | -1,702.4 | -3,243.0 | -5,284.5 | -6,328.5 | 6,107.2 | -27,200.1 | -42,294.8 | -65,766.5 | -102,263.8 | -159,015.4 |
| EBIT, % | -11.9 | -19.4 | -15.49 | -17.66 | 4.21 | -12.05 | -12.05 | -12.05 | -12.05 | -12.05 |
| Total Cash | 3,109.3 | 6,152.6 | 18,116.3 | 14,895.1 | 50,004.2 | 84,726.7 | 131,746.0 | 204,858.9 | 318,546.0 | 495,324.1 |
| Total Cash, percent | .0 | .0 | .0 | .0 | .0 | .0 | .0 | .0 | .0 | .0 |
| Account Receivables | 3,487.8 | 2,330.5 | 2,961.3 | 2,967.6 | 3,315.2 | 25,993.0 | 40,417.9 | 62,847.9 | 97,725.6 | 151,958.7 |
| Account Receivables, % | 24.39 | 13.94 | 8.68 | 8.28 | 2.28 | 11.51 | 11.51 | 11.51 | 11.51 | 11.51 |
| Inventories | 1,973.7 | 2,772.9 | 3,992.9 | 3,529.2 | 2,552.4 | 24,243.9 | 37,698.1 | 58,618.8 | 91,149.5 | 141,733.1 |
| Inventories, % | 13.8 | 16.59 | 11.71 | 9.85 | 1.76 | 10.74 | 10.74 | 10.74 | 10.74 | 10.74 |
| Accounts Payable | 10,937.1 | 13,911.0 | 25,670.2 | 30,150.1 | 24,067.1 | 151,538.5 | 235,635.2 | 366,401.8 | 569,737.6 | 885,915.4 |
| Accounts Payable, % | 76.47 | 83.21 | 75.27 | 84.12 | 16.58 | 67.13 | 67.13 | 67.13 | 67.13 | 67.13 |
| Capital Expenditure | -1,845.6 | -2,133.0 | -3,367.0 | -3,464.8 | -7,143.9 | -22,629.8 | -35,188.3 | -54,716.1 | -85,081.0 | -132,297.0 |
| Capital Expenditure, % | -12.9 | -12.76 | -9.87 | -9.67 | -4.92 | -10.02 | -10.02 | -10.02 | -10.02 | -10.02 |
| Tax Rate, % | -20.09 | -20.09 | -20.09 | -20.09 | -20.09 | -20.09 | -20.09 | -20.09 | -20.09 | -20.09 |
| EBITAT | -1,345.4 | -2,266.4 | -4,107.0 | -3,798.9 | 7,333.9 | -21,034.7 | -32,708.0 | -50,859.3 | -79,083.9 | -122,971.7 |
| Depreciation | ||||||||||
| Changes in Account Receivables | ||||||||||
| Changes in Inventories | ||||||||||
| Changes in Accounts Payable | ||||||||||
| Capital Expenditure | ||||||||||
| UFCF | 3,617.8 | 554.5 | 4,598.0 | 178.2 | -1,527.5 | 55,207.6 | 12,842.8 | 19,970.0 | 31,052.5 | 48,285.1 |
| WACC, % | 11.33 | 11.32 | 11.33 | 11.31 | 11.36 | 11.33 | 11.33 | 11.33 | 11.33 | 11.33 |
| PV UFCF | ||||||||||
| SUM PV UFCF | 122,862.1 | |||||||||
| Long Term Growth Rate, % | 2.00 | |||||||||
| Free cash flow (T + 1) | 49,251 | |||||||||
| Terminal Value | 527,731 | |||||||||
| Present Terminal Value | 308,533 | |||||||||
| Enterprise Value | 431,395 | |||||||||
| Net Debt | -43,051 | |||||||||
| Equity Value | 474,445 | |||||||||
| Diluted Shares Outstanding, MM | 1,509 | |||||||||
| Equity Value Per Share | 314.34 |
Benefits You Will Receive
- Customizable Forecast Inputs: Modify assumptions (growth %, profit margins, WACC) effortlessly to explore various scenarios.
- Comprehensive Financial Data: Pre-loaded financial information from Seres Group Co., Ltd. (601127SS) to kickstart your analysis.
- Automated DCF Calculations: The model calculates Net Present Value (NPV) and intrinsic value automatically for your convenience.
- Professional and Adaptable: A sleek Excel template that adjusts to fit your specific valuation requirements.
- Designed for Analysts and Investors: Perfect for evaluating projections, assessing strategies, and enhancing efficiency.
Key Features
- Reliable Financial Data: Gain access to precise historical data and forward-looking projections for Seres Group Co.,Ltd. (601127SS).
- Flexible Forecast Settings: Modify fields highlighted in yellow, including WACC, growth rates, and profit margins.
- Automated Calculations: Enjoy real-time updates for DCF, Net Present Value (NPV), and cash flow analyses.
- User-Friendly Dashboard: View easily digestible charts and summaries to help you interpret your valuation findings.
- Designed for Everyone: An intuitive layout tailored for investors, CFOs, and consultants, regardless of experience level.
How It Works
- Step 1: Download the Excel file.
- Step 2: Review the pre-filled data for Seres Group Co., Ltd. (601127SS) including both historical and projected figures.
- Step 3: Modify key assumptions (highlighted in yellow) according to your analysis.
- Step 4: Observe the automatic recalculations reflecting Seres Group's intrinsic value.
- Step 5: Utilize the results for your investment decisions or reporting needs.
Why Choose the Seres Group Calculator?
- Reliable Data: Utilize accurate financials from Seres Group (601127SS) for trustworthy valuation outcomes.
- Tailored Options: Modify essential factors such as growth projections, WACC, and tax rates to align with your expectations.
- Efficiency Boost: Pre-configured calculations save you the hassle of starting from the ground up.
- Expert Tool: Crafted for investors, analysts, and consultants seeking professional insights.
- Easy to Use: A user-friendly design with clear, step-by-step guidance makes it accessible for everyone.
Who Can Benefit from Seres Group Co., Ltd. (601127SS)?
- Finance Students: Explore valuation methodologies and apply them to actual case studies.
- Researchers: Integrate industry-specific models into your academic projects or studies.
- Investors: Validate your investment strategies and evaluate the valuation results for Seres Group Co., Ltd. (601127SS).
- Market Analysts: Enhance your analytical processes with a customizable DCF model tailored for the industry.
- Entrepreneurs: Understand the valuation approaches used for large corporations like Seres Group Co., Ltd. (601127SS).
What the Template Includes
- Historical Data: Contains Seres Group Co., Ltd.'s past financials and foundational forecasts.
- DCF and Levered DCF Models: Comprehensive templates for calculating the intrinsic value of Seres Group Co., Ltd. (601127SS).
- WACC Sheet: Pre-structured calculations for the Weighted Average Cost of Capital.
- Editable Inputs: Adjust key factors such as growth rates, EBITDA %, and CAPEX assumptions.
- Quarterly and Annual Statements: A thorough breakdown of Seres Group Co., Ltd. (601127SS)'s financial performance.
- Interactive Dashboard: Dynamically visualize valuation outcomes and projections.
Disclaimer
All information, articles, and product details provided on this website are for general informational and educational purposes only. We do not claim any ownership over, nor do we intend to infringe upon, any trademarks, copyrights, logos, brand names, or other intellectual property mentioned or depicted on this site. Such intellectual property remains the property of its respective owners, and any references here are made solely for identification or informational purposes, without implying any affiliation, endorsement, or partnership.
We make no representations or warranties, express or implied, regarding the accuracy, completeness, or suitability of any content or products presented. Nothing on this website should be construed as legal, tax, investment, financial, medical, or other professional advice. In addition, no part of this site—including articles or product references—constitutes a solicitation, recommendation, endorsement, advertisement, or offer to buy or sell any securities, franchises, or other financial instruments, particularly in jurisdictions where such activity would be unlawful.
All content is of a general nature and may not address the specific circumstances of any individual or entity. It is not a substitute for professional advice or services. Any actions you take based on the information provided here are strictly at your own risk. You accept full responsibility for any decisions or outcomes arising from your use of this website and agree to release us from any liability in connection with your use of, or reliance upon, the content or products found herein.