
|
Ningbo Boway Alloy Material Company Limited (601137.SS) DCF -Bewertung |
Fully Editable: Tailor To Your Needs In Excel Or Sheets
Professional Design: Trusted, Industry-Standard Templates
Investor-Approved Valuation Models
MAC/PC Compatible, Fully Unlocked
No Expertise Is Needed; Easy To Follow
Ningbo Boway Alloy Material Company Limited (601137.SS) Bundle
Unser (601137S) DCF-Taschenrechner entwickelt für die Genauigkeit und ermöglicht es Ihnen, die Bewertung von Ningbo Boway Alloy Company Limited unter Verwendung realer Finanzdaten zu bewerten, und bietet vollständige Flexibilität, um alle wesentlichen Parameter für verbesserte Projektionen zu ändern.
Discounted Cash Flow (DCF) - (USD MM)
| Year | AY1 2020 |
AY2 2021 |
AY3 2022 |
AY4 2023 |
AY5 2024 |
FY1 2025 |
FY2 2026 |
FY3 2027 |
FY4 2028 |
FY5 2029 |
|---|---|---|---|---|---|---|---|---|---|---|
| Revenue | 7,588.7 | 10,038.0 | 13,447.8 | 17,755.8 | 18,655.0 | 23,474.7 | 29,539.6 | 37,171.4 | 46,774.9 | 58,859.5 |
| Revenue Growth, % | 0 | 32.27 | 33.97 | 32.03 | 5.06 | 25.84 | 25.84 | 25.84 | 25.84 | 25.84 |
| EBITDA | 838.3 | 751.0 | 1,099.7 | 1,900.4 | 2,204.4 | 2,311.1 | 2,908.1 | 3,659.5 | 4,604.9 | 5,794.7 |
| EBITDA, % | 11.05 | 7.48 | 8.18 | 10.7 | 11.82 | 9.84 | 9.84 | 9.84 | 9.84 | 9.84 |
| Depreciation | 267.5 | 296.7 | 359.2 | 452.2 | 469.6 | 667.4 | 839.8 | 1,056.8 | 1,329.8 | 1,673.4 |
| Depreciation, % | 3.52 | 2.96 | 2.67 | 2.55 | 2.52 | 2.84 | 2.84 | 2.84 | 2.84 | 2.84 |
| EBIT | 570.8 | 454.2 | 740.6 | 1,448.2 | 1,734.8 | 1,643.7 | 2,068.3 | 2,602.7 | 3,275.1 | 4,121.2 |
| EBIT, % | 7.52 | 4.52 | 5.51 | 8.16 | 9.3 | 7 | 7 | 7 | 7 | 7 |
| Total Cash | 791.8 | 1,266.5 | 1,483.9 | 3,135.0 | 2,276.8 | 3,002.2 | 3,777.9 | 4,753.9 | 5,982.1 | 7,527.7 |
| Total Cash, percent | .0 | .0 | .0 | .0 | .0 | .0 | .0 | .0 | .0 | .0 |
| Account Receivables | 1,094.5 | 1,340.2 | 1,790.4 | 1,990.9 | 2,638.4 | 3,119.4 | 3,925.4 | 4,939.5 | 6,215.7 | 7,821.6 |
| Account Receivables, % | 14.42 | 13.35 | 13.31 | 11.21 | 14.14 | 13.29 | 13.29 | 13.29 | 13.29 | 13.29 |
| Inventories | 1,989.2 | 3,329.0 | 4,781.7 | 4,780.5 | 5,266.7 | 7,046.6 | 8,867.2 | 11,158.1 | 14,040.8 | 17,668.4 |
| Inventories, % | 26.21 | 33.16 | 35.56 | 26.92 | 28.23 | 30.02 | 30.02 | 30.02 | 30.02 | 30.02 |
| Accounts Payable | 705.4 | 1,492.6 | 2,139.8 | 1,991.7 | 554.7 | 2,547.8 | 3,206.0 | 4,034.4 | 5,076.7 | 6,388.3 |
| Accounts Payable, % | 9.29 | 14.87 | 15.91 | 11.22 | 2.97 | 10.85 | 10.85 | 10.85 | 10.85 | 10.85 |
| Capital Expenditure | -1,238.1 | -1,001.4 | -940.3 | -882.7 | -1,671.1 | -2,216.6 | -2,789.3 | -3,509.9 | -4,416.7 | -5,557.8 |
| Capital Expenditure, % | -16.31 | -9.98 | -6.99 | -4.97 | -8.96 | -9.44 | -9.44 | -9.44 | -9.44 | -9.44 |
| Tax Rate, % | 12.45 | 12.45 | 12.45 | 12.45 | 12.45 | 12.45 | 12.45 | 12.45 | 12.45 | 12.45 |
| EBITAT | 528.6 | 416.8 | 662.7 | 1,265.6 | 1,518.8 | 1,475.3 | 1,856.5 | 2,336.1 | 2,939.7 | 3,699.2 |
| Depreciation | ||||||||||
| Changes in Account Receivables | ||||||||||
| Changes in Inventories | ||||||||||
| Changes in Accounts Payable | ||||||||||
| Capital Expenditure | ||||||||||
| UFCF | -2,820.4 | -1,086.1 | -1,174.1 | 487.6 | -2,253.4 | -341.8 | -2,061.2 | -2,593.7 | -3,263.8 | -4,107.1 |
| WACC, % | 4.75 | 4.74 | 4.73 | 4.71 | 4.71 | 4.73 | 4.73 | 4.73 | 4.73 | 4.73 |
| PV UFCF | ||||||||||
| SUM PV UFCF | -10,436.9 | |||||||||
| Long Term Growth Rate, % | 3.50 | |||||||||
| Free cash flow (T + 1) | -4,251 | |||||||||
| Terminal Value | -346,162 | |||||||||
| Present Terminal Value | -274,768 | |||||||||
| Enterprise Value | -285,205 | |||||||||
| Net Debt | 1,848 | |||||||||
| Equity Value | -287,053 | |||||||||
| Diluted Shares Outstanding, MM | 862 | |||||||||
| Equity Value Per Share | -332.96 |
What You Will Receive
- Customizable Excel Template: A fully editable Excel-based DCF Calculator featuring pre-filled financial data for Ningbo Boway Alloy Material Company Limited (601137SS).
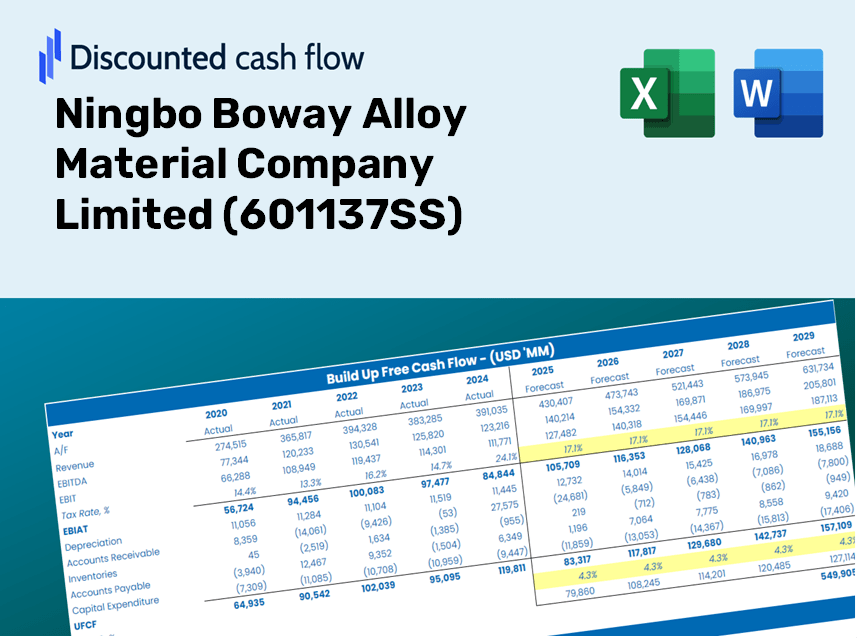
- Authentic Data: Access to historical data and future estimates (highlighted in the yellow cells).
- Flexible Forecasting: Modify forecast parameters such as revenue growth, EBITDA %, and WACC as needed.
- Instant Calculations: Quickly observe how your inputs affect the valuation of Ningbo Boway Alloy Material Company Limited (601137SS).
- Professional Resource: Designed for investors, CFOs, consultants, and financial analysts.
- Intuitive Design: Organized for simplicity and ease of navigation, complete with step-by-step guidance.
Key Features
- Comprehensive DCF Calculator: Features detailed unlevered and levered DCF valuation models tailored for Ningbo Boway Alloy Material Company Limited (601137SS).
- WACC Calculator: A pre-configured Weighted Average Cost of Capital sheet with adjustable inputs for enhanced accuracy.
- Customizable Forecast Assumptions: Adjust growth rates, capital expenditures, and discount rates to suit specific scenarios.
- Integrated Financial Ratios: Evaluate profitability, leverage, and efficiency ratios specifically for Ningbo Boway Alloy Material Company Limited (601137SS).
- Interactive Dashboard and Charts: Visual representations of key valuation metrics facilitate straightforward analysis.
How It Functions
- Step 1: Download the Excel file for Ningbo Boway Alloy Material Company Limited (601137SS).
- Step 2: Review the pre-populated financial data and forecasts provided for the company.
- Step 3: Adjust key inputs such as revenue growth, WACC, and tax rates (highlighted cells).
- Step 4: Observe the DCF model refresh instantaneously as you alter your assumptions.
- Step 5: Evaluate the outputs and utilize the results to inform your investment choices.
Why Choose Ningbo Boway Alloy Material Company Limited (601137SS)?
- Precision: Our financial reports reflect the true performance of the company.
- Adaptability: Users can easily adjust and experiment with input variables.
- Efficiency: Save time by leveraging our ready-made financial models.
- Expert-Level: Crafted with the expertise and detail expected from top-level finance professionals.
- Intuitive: Designed for simplicity, making it accessible for all users, regardless of financial modeling background.
Who Should Utilize This Product?
- Individual Investors: Make well-informed choices regarding the purchase or sale of Ningbo Boway Alloy Material Company Limited (601137SS) stock.
- Financial Analysts: Optimize valuation processes with ready-to-implement financial models tailored for Ningbo Boway Alloy Material Company Limited (601137SS).
- Consultants: Provide clients with accurate and timely valuation insights related to Ningbo Boway Alloy Material Company Limited (601137SS).
- Business Owners: Learn about the valuation strategies of major players like Ningbo Boway Alloy Material Company Limited (601137SS) to inform your own business decisions.
- Finance Students: Master valuation techniques using practical data and scenarios centered on Ningbo Boway Alloy Material Company Limited (601137SS).
Contents of the Template
- Preloaded 601137SS Data: Historical and forecasted financial information, covering revenue, EBIT, and capital expenditures.
- DCF and WACC Models: Advanced worksheets for computing intrinsic value and Weighted Average Cost of Capital.
- Editable Inputs: Yellow-highlighted cells for modifying revenue growth, tax rates, and discount rates.
- Financial Statements: Detailed annual and quarterly financial statements for in-depth analysis.
- Key Ratios: Profitability, leverage, and efficiency ratios to assess performance.
- Dashboard and Charts: Visual representations of valuation results and assumptions.
Disclaimer
All information, articles, and product details provided on this website are for general informational and educational purposes only. We do not claim any ownership over, nor do we intend to infringe upon, any trademarks, copyrights, logos, brand names, or other intellectual property mentioned or depicted on this site. Such intellectual property remains the property of its respective owners, and any references here are made solely for identification or informational purposes, without implying any affiliation, endorsement, or partnership.
We make no representations or warranties, express or implied, regarding the accuracy, completeness, or suitability of any content or products presented. Nothing on this website should be construed as legal, tax, investment, financial, medical, or other professional advice. In addition, no part of this site—including articles or product references—constitutes a solicitation, recommendation, endorsement, advertisement, or offer to buy or sell any securities, franchises, or other financial instruments, particularly in jurisdictions where such activity would be unlawful.
All content is of a general nature and may not address the specific circumstances of any individual or entity. It is not a substitute for professional advice or services. Any actions you take based on the information provided here are strictly at your own risk. You accept full responsibility for any decisions or outcomes arising from your use of this website and agree to release us from any liability in connection with your use of, or reliance upon, the content or products found herein.