
|
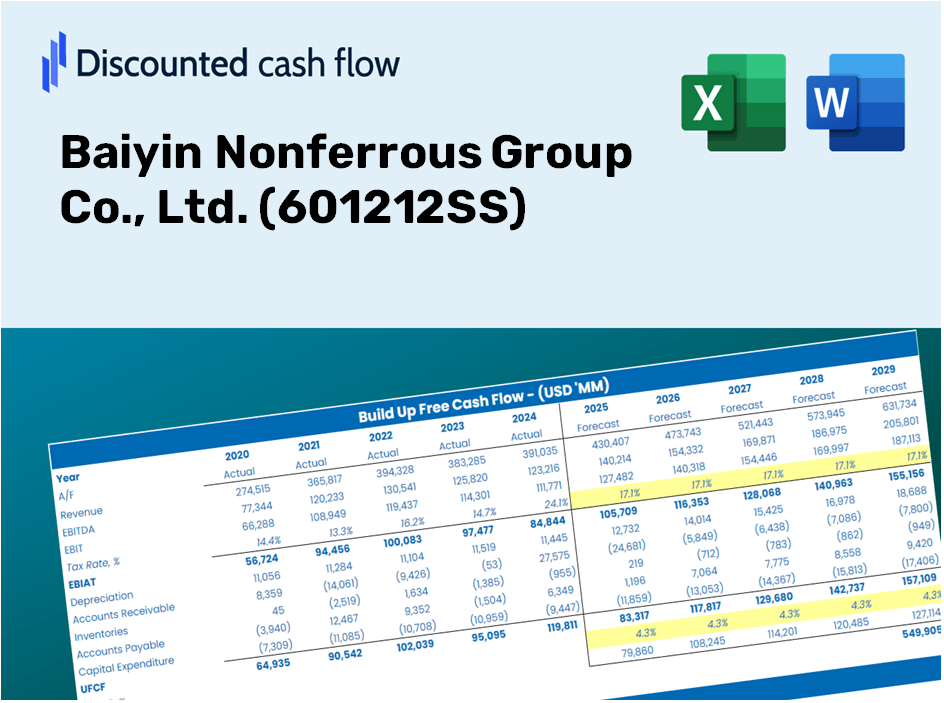
Baiyin Nonferrous Group Co., Ltd. (601212.SS) DCF -Bewertung |
Fully Editable: Tailor To Your Needs In Excel Or Sheets
Professional Design: Trusted, Industry-Standard Templates
Investor-Approved Valuation Models
MAC/PC Compatible, Fully Unlocked
No Expertise Is Needed; Easy To Follow
Baiyin Nonferrous Group Co., Ltd. (601212.SS) Bundle
Vereinfachen Sie die Bewertung von Baiyin Nonferrous Group Co., Ltd. (601212SS) mit diesem anpassbaren DCF -Taschenrechner! Mit Real Baiyin Nonferrous Group Co., Ltd. (601212S) Finanzdaten und einstellbaren Prognoseeingaben können Sie Szenarien testen und Baiyin Nonglütiger Gruppengruppe Co., Ltd. (601212SS) beizulegen.
Discover What You Will Receive
- Customizable Excel Template: A fully adaptable Excel-based DCF Calculator featuring pre-filled financial data for Baiyin Nonferrous Group Co., Ltd. (601212SS).
- Comprehensive Data: Access to historical figures and future projections (highlighted in the yellow cells).
- Assumption Flexibility: Adjust key forecast parameters such as revenue growth, EBITDA %, and WACC.
- Instant Calculations: Quickly visualize how your inputs influence the valuation of Baiyin Nonferrous Group Co., Ltd. (601212SS).
- Professional-Grade Tool: Designed for investors, CFOs, consultants, and financial analysts.
- Intuitive Interface: Organized for clarity and user-friendliness, complete with step-by-step guidance.
Key Features
- Comprehensive Financial Data: Baiyin Nonferrous Group Co., Ltd.'s historical financial statements and pre-filled projections.
- Customizable Parameters: Modify WACC, tax rates, revenue growth, and EBITDA margins as needed.
- Real-Time Calculations: Observe instant recalculations of Baiyin Nonferrous Group Co., Ltd.'s intrinsic value.
- Intuitive Visualizations: Dashboard charts present valuation results and essential metrics clearly.
- Designed for Precision: A reliable tool tailored for analysts, investors, and finance professionals.
How It Works
- Step 1: Download the prebuilt Excel template featuring Baiyin Nonferrous Group Co., Ltd. (601212SS) data.
- Step 2: Review the pre-filled sheets to familiarize yourself with essential metrics.
- Step 3: Modify forecasts and assumptions in the editable yellow cells (WACC, growth, margins).
- Step 4: Instantly access recalculated results, including the intrinsic value of Baiyin Nonferrous Group Co., Ltd. (601212SS).
- Step 5: Make well-informed investment decisions or create reports based on the generated outputs.
Why Opt for This Calculator?
- Designed for Experts: A sophisticated tool tailored for analysts, CFOs, and consultants.
- Comprehensive Data: Historical and projected financials of Baiyin Nonferrous Group Co., Ltd. (601212SS) included for precision.
- Scenario Analysis: Easily simulate various forecasts and assumptions.
- Transparent Results: Automatically computes intrinsic value, NPV, and essential metrics.
- User-Friendly: Step-by-step guidance makes the process straightforward.
Who Can Benefit from This Product?
- Students in Finance: Master valuation methods and apply them with actual market data.
- Researchers and Academics: Integrate industry-standard models into your academic projects or studies.
- Investors: Validate your hypotheses and evaluate valuation scenarios for Baiyin Nonferrous Group Co., Ltd. (601212SS).
- Financial Analysts: Enhance your efficiency with a ready-to-use, customizable DCF model.
- Entrepreneurs: Understand the analytical approaches used for major public firms like Baiyin Nonferrous Group Co., Ltd. (601212SS).
Contents of the Template
- Detailed DCF Model: Customizable template featuring in-depth valuation calculations.
- Real-World Financial Data: Baiyin Nonferrous Group Co., Ltd.'s historical and projected financials are included for thorough analysis.
- Flexible Parameters: Modify WACC, growth assumptions, and tax rates to explore various scenarios.
- Comprehensive Financial Statements: Complete annual and quarterly reports for enhanced insights.
- Essential Ratios: Integrated analysis for assessing profitability, operational efficiency, and financial leverage.
- Dashboard with Visual Representations: Visuals and tables to present results in a clear and actionable format.
Disclaimer
All information, articles, and product details provided on this website are for general informational and educational purposes only. We do not claim any ownership over, nor do we intend to infringe upon, any trademarks, copyrights, logos, brand names, or other intellectual property mentioned or depicted on this site. Such intellectual property remains the property of its respective owners, and any references here are made solely for identification or informational purposes, without implying any affiliation, endorsement, or partnership.
We make no representations or warranties, express or implied, regarding the accuracy, completeness, or suitability of any content or products presented. Nothing on this website should be construed as legal, tax, investment, financial, medical, or other professional advice. In addition, no part of this site—including articles or product references—constitutes a solicitation, recommendation, endorsement, advertisement, or offer to buy or sell any securities, franchises, or other financial instruments, particularly in jurisdictions where such activity would be unlawful.
All content is of a general nature and may not address the specific circumstances of any individual or entity. It is not a substitute for professional advice or services. Any actions you take based on the information provided here are strictly at your own risk. You accept full responsibility for any decisions or outcomes arising from your use of this website and agree to release us from any liability in connection with your use of, or reliance upon, the content or products found herein.