
|
Huadian Heavy Industries Co., Ltd. (601226.SS) DCF -Bewertung |
Fully Editable: Tailor To Your Needs In Excel Or Sheets
Professional Design: Trusted, Industry-Standard Templates
Investor-Approved Valuation Models
MAC/PC Compatible, Fully Unlocked
No Expertise Is Needed; Easy To Follow
Huadian Heavy Industries Co., Ltd. (601226.SS) Bundle
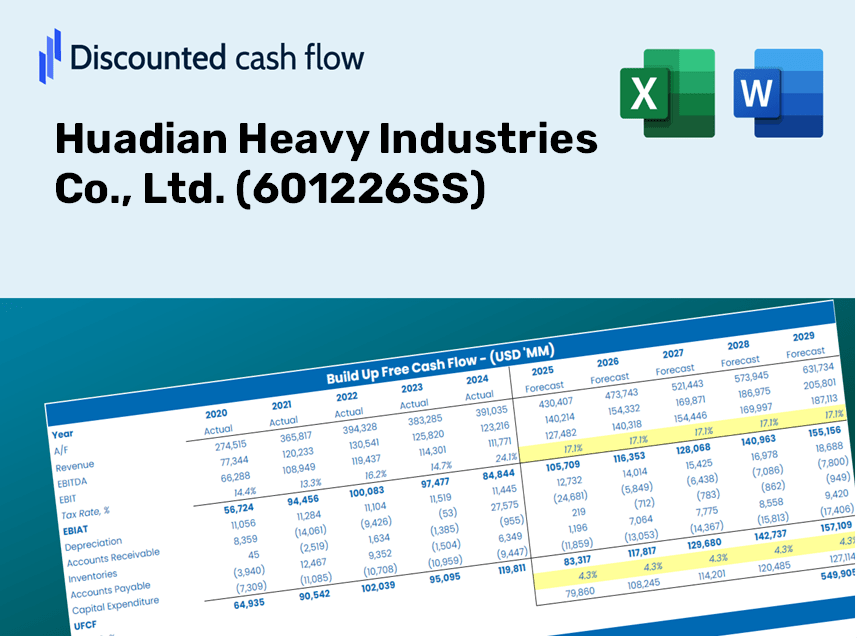
Als Anleger oder Analyst ist der DCF-Taschenrechner für Huadian Heavy Industries Co., Ltd. (601226S) Ihre Anlaufstelle für eine genaue Bewertung. Mit realen Daten aus der huadischen Schwerindustrie können Sie Prognosen anpassen und die Auswirkungen sofort beobachten.
Discounted Cash Flow (DCF) - (USD MM)
| Year | AY1 2020 |
AY2 2021 |
AY3 2022 |
AY4 2023 |
AY5 2024 |
FY1 2025 |
FY2 2026 |
FY3 2027 |
FY4 2028 |
FY5 2029 |
|---|---|---|---|---|---|---|---|---|---|---|
| Revenue | 8,906.4 | 10,329.0 | 8,206.1 | 7,174.5 | 7,541.2 | 7,314.2 | 7,094.1 | 6,880.5 | 6,673.4 | 6,472.6 |
| Revenue Growth, % | 0 | 15.97 | -20.55 | -12.57 | 5.11 | -3.01 | -3.01 | -3.01 | -3.01 | -3.01 |
| EBITDA | 250.2 | 393.0 | 478.4 | 194.5 | 219.9 | 264.4 | 256.4 | 248.7 | 241.2 | 233.9 |
| EBITDA, % | 2.81 | 3.81 | 5.83 | 2.71 | 2.92 | 3.61 | 3.61 | 3.61 | 3.61 | 3.61 |
| Depreciation | 75.6 | 78.8 | 96.3 | 106.5 | 107.5 | 83.3 | 80.8 | 78.4 | 76.0 | 73.7 |
| Depreciation, % | 0.84848 | 0.763 | 1.17 | 1.48 | 1.43 | 1.14 | 1.14 | 1.14 | 1.14 | 1.14 |
| EBIT | 174.6 | 314.2 | 382.1 | 88.0 | 112.4 | 181.1 | 175.6 | 170.3 | 165.2 | 160.2 |
| EBIT, % | 1.96 | 3.04 | 4.66 | 1.23 | 1.49 | 2.48 | 2.48 | 2.48 | 2.48 | 2.48 |
| Total Cash | 2,426.6 | 2,674.8 | 2,577.5 | 2,497.5 | 2,557.7 | 2,242.2 | 2,174.7 | 2,109.3 | 2,045.8 | 1,984.2 |
| Total Cash, percent | .0 | .0 | .0 | .0 | .0 | .0 | .0 | .0 | .0 | .0 |
| Account Receivables | 3,393.0 | 4,472.3 | 4,291.5 | 4,457.4 | 5,271.3 | 3,887.1 | 3,770.1 | 3,656.6 | 3,546.5 | 3,439.8 |
| Account Receivables, % | 38.1 | 43.3 | 52.3 | 62.13 | 69.9 | 53.14 | 53.14 | 53.14 | 53.14 | 53.14 |
| Inventories | 802.5 | 714.1 | 824.5 | 699.0 | 651.9 | 648.9 | 629.4 | 610.4 | 592.0 | 574.2 |
| Inventories, % | 9.01 | 6.91 | 10.05 | 9.74 | 8.64 | 8.87 | 8.87 | 8.87 | 8.87 | 8.87 |
| Accounts Payable | 3,516.9 | 4,874.5 | 5,608.1 | 5,954.7 | 5,655.9 | 4,579.0 | 4,441.1 | 4,307.5 | 4,177.8 | 4,052.1 |
| Accounts Payable, % | 39.49 | 47.19 | 68.34 | 83 | 75 | 62.6 | 62.6 | 62.6 | 62.6 | 62.6 |
| Capital Expenditure | -35.6 | -259.6 | -73.6 | -55.8 | -69.6 | -80.6 | -78.2 | -75.8 | -73.6 | -71.3 |
| Capital Expenditure, % | -0.39923 | -2.51 | -0.89728 | -0.77794 | -0.92347 | -1.1 | -1.1 | -1.1 | -1.1 | -1.1 |
| Tax Rate, % | 26.72 | 26.72 | 26.72 | 26.72 | 26.72 | 26.72 | 26.72 | 26.72 | 26.72 | 26.72 |
| EBITAT | 134.1 | 275.3 | 313.6 | 77.5 | 82.4 | 147.7 | 143.2 | 138.9 | 134.7 | 130.7 |
| Depreciation | ||||||||||
| Changes in Account Receivables | ||||||||||
| Changes in Inventories | ||||||||||
| Changes in Accounts Payable | ||||||||||
| Capital Expenditure | ||||||||||
| UFCF | -504.4 | 461.2 | 1,140.1 | 434.4 | -945.3 | 460.6 | 144.5 | 140.2 | 135.9 | 131.8 |
| WACC, % | 10.14 | 10.17 | 10.15 | 10.17 | 10.14 | 10.15 | 10.15 | 10.15 | 10.15 | 10.15 |
| PV UFCF | ||||||||||
| SUM PV UFCF | 815.7 | |||||||||
| Long Term Growth Rate, % | 3.00 | |||||||||
| Free cash flow (T + 1) | 136 | |||||||||
| Terminal Value | 1,898 | |||||||||
| Present Terminal Value | 1,171 | |||||||||
| Enterprise Value | 1,986 | |||||||||
| Net Debt | -2,531 | |||||||||
| Equity Value | 4,517 | |||||||||
| Diluted Shares Outstanding, MM | 1,162 | |||||||||
| Equity Value Per Share | 3.89 |
What You Will Receive
- Authentic Huadian Data: Preloaded financial metrics – from revenue to EBIT – based on both actual and projected figures.
- Comprehensive Customization: Modify all key inputs (yellow cells) such as WACC, growth %, and tax rates.
- Real-Time Valuation Updates: Automatic recalculations to assess the effects of changes on Huadian Heavy Industries' fair value.
- Flexible Excel Template: Designed for easy adjustments, scenario analysis, and in-depth projections.
- Efficient and Accurate: Avoid the hassle of building models from scratch while ensuring precision and adaptability.
Highlighted Features
- Customizable Forecast Inputs: Adjust essential elements such as revenue growth, EBITDA percentage, and capital investments.
- Instant DCF Valuation: Quickly calculates intrinsic value, NPV, and other key metrics.
- High Precision Results: Incorporates Huadian Heavy Industries' (601226SS) actual financial data for accurate valuation assessments.
- Effortless Scenario Evaluation: Easily explore various assumptions and analyze different outcomes.
- Efficiency Boosting Tool: Remove the hassle of creating intricate valuation models from the ground up.
How It Functions
- Download: Obtain the pre-prepared Excel file containing Huadian Heavy Industries Co., Ltd.'s financial data.
- Customize: Modify forecasts such as revenue growth, EBITDA percentage, and WACC.
- Real-Time Updates: The intrinsic value and NPV calculations refresh automatically as data changes.
- Scenario Testing: Develop various projections and instantly compare the outcomes.
- Decision Making: Leverage the valuation results to inform your investment strategy for Huadian Heavy Industries Co., Ltd. (601226SS).
Why Choose This Calculator for Huadian Heavy Industries Co., Ltd. (601226SS)?
- User-Friendly Interface: Tailored for both novices and seasoned users.
- Customizable Inputs: Adjust parameters easily to fit your analysis needs.
- Real-Time Valuation Changes: Observe immediate updates to Huadian's valuation as you modify inputs.
- Preloaded Financial Data: Comes equipped with Huadian's actual financial metrics for swift evaluations.
- Relied Upon by Experts: A go-to tool for investors and analysts aiming for data-driven decisions.
Who Can Benefit from This Product?
- Institutional Investors: Develop comprehensive and trustworthy valuation models for investment analysis of Huadian Heavy Industries Co., Ltd. (601226SS).
- Corporate Finance Departments: Evaluate valuation scenarios to inform strategic decisions within the company.
- Finance Consultants and Advisors: Deliver precise valuation insights to clients interested in Huadian Heavy Industries Co., Ltd. (601226SS).
- Academic Students and Instructors: Leverage real-time data for practical applications in financial modeling education.
- Industry Enthusiasts: Gain insights into how industrial companies like Huadian Heavy Industries Co., Ltd. (601226SS) are appraised in the market.
Contents of the Template
- Operating and Balance Sheet Data: Pre-filled historical data and forecasts for Huadian Heavy Industries Co., Ltd. (601226SS), including revenue, EBITDA, EBIT, and capital expenditures.
- WACC Calculation: A dedicated sheet for calculating the Weighted Average Cost of Capital (WACC), featuring parameters such as Beta, risk-free rate, and share price.
- DCF Valuation (Unlevered and Levered): Customizable Discounted Cash Flow models that provide intrinsic value with comprehensive calculations.
- Financial Statements: Pre-loaded financial statements (annual and quarterly) to facilitate thorough analysis.
- Key Ratios: Includes profitability, leverage, and efficiency ratios specific to Huadian Heavy Industries Co., Ltd. (601226SS).
- Dashboard and Charts: A visual summary of valuation outputs and assumptions for easy analysis of results.
Disclaimer
All information, articles, and product details provided on this website are for general informational and educational purposes only. We do not claim any ownership over, nor do we intend to infringe upon, any trademarks, copyrights, logos, brand names, or other intellectual property mentioned or depicted on this site. Such intellectual property remains the property of its respective owners, and any references here are made solely for identification or informational purposes, without implying any affiliation, endorsement, or partnership.
We make no representations or warranties, express or implied, regarding the accuracy, completeness, or suitability of any content or products presented. Nothing on this website should be construed as legal, tax, investment, financial, medical, or other professional advice. In addition, no part of this site—including articles or product references—constitutes a solicitation, recommendation, endorsement, advertisement, or offer to buy or sell any securities, franchises, or other financial instruments, particularly in jurisdictions where such activity would be unlawful.
All content is of a general nature and may not address the specific circumstances of any individual or entity. It is not a substitute for professional advice or services. Any actions you take based on the information provided here are strictly at your own risk. You accept full responsibility for any decisions or outcomes arising from your use of this website and agree to release us from any liability in connection with your use of, or reliance upon, the content or products found herein.