
|
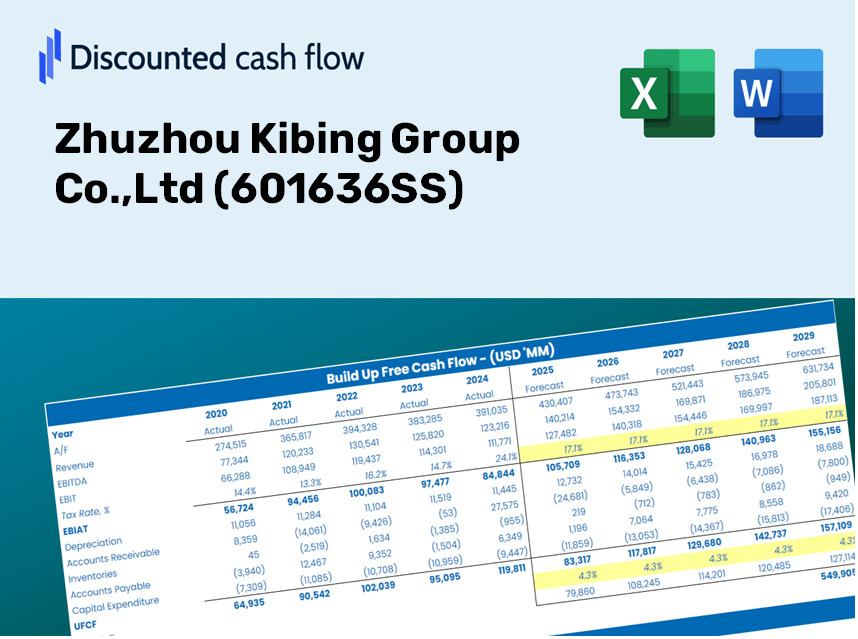
Zhuzhou Kibing Group Co., Ltd (601636.SS) DCF -Bewertung |
Fully Editable: Tailor To Your Needs In Excel Or Sheets
Professional Design: Trusted, Industry-Standard Templates
Investor-Approved Valuation Models
MAC/PC Compatible, Fully Unlocked
No Expertise Is Needed; Easy To Follow
Zhuzhou Kibing Group Co.,Ltd (601636.SS) Bundle
Entdecken Sie die finanziellen Aussichten von Zhuzhou Kibing Group Co., Ltd mit unserem benutzerfreundlichen DCF-Taschenrechner! Geben Sie Ihre Annahmen in Bezug auf Wachstum, Margen und Kosten ein, um den inneren Wert von Zhuzhou Kibing Group Co., Ltd, zu berechnen und Ihren Investitionsansatz zu verfeinern.
Discounted Cash Flow (DCF) - (USD MM)
| Year | AY1 2020 |
AY2 2021 |
AY3 2022 |
AY4 2023 |
AY5 2024 |
FY1 2025 |
FY2 2026 |
FY3 2027 |
FY4 2028 |
FY5 2029 |
|---|---|---|---|---|---|---|---|---|---|---|
| Revenue | 9,643.4 | 14,696.6 | 13,312.7 | 15,682.7 | 15,649.2 | 18,019.0 | 20,747.7 | 23,889.5 | 27,507.2 | 31,672.6 |
| Revenue Growth, % | 0 | 52.4 | -9.42 | 17.8 | -0.21377 | 15.14 | 15.14 | 15.14 | 15.14 | 15.14 |
| EBITDA | 3,156.7 | 5,909.2 | 2,381.8 | 3,323.3 | 2,085.5 | 4,517.4 | 5,201.5 | 5,989.2 | 6,896.1 | 7,940.4 |
| EBITDA, % | 32.73 | 40.21 | 17.89 | 21.19 | 13.33 | 25.07 | 25.07 | 25.07 | 25.07 | 25.07 |
| Depreciation | 936.1 | 962.6 | 1,038.4 | 1,224.2 | 1,591.9 | 1,514.9 | 1,744.3 | 2,008.4 | 2,312.6 | 2,662.8 |
| Depreciation, % | 9.71 | 6.55 | 7.8 | 7.81 | 10.17 | 8.41 | 8.41 | 8.41 | 8.41 | 8.41 |
| EBIT | 2,220.7 | 4,946.5 | 1,343.4 | 2,099.1 | 493.7 | 3,002.5 | 3,457.2 | 3,980.7 | 4,583.5 | 5,277.6 |
| EBIT, % | 23.03 | 33.66 | 10.09 | 13.38 | 3.15 | 16.66 | 16.66 | 16.66 | 16.66 | 16.66 |
| Total Cash | 1,189.8 | 5,253.6 | 3,326.5 | 3,691.7 | 3,234.5 | 4,226.6 | 4,866.6 | 5,603.6 | 6,452.2 | 7,429.2 |
| Total Cash, percent | .0 | .0 | .0 | .0 | .0 | .0 | .0 | .0 | .0 | .0 |
| Account Receivables | 271.7 | 329.0 | 1,276.2 | 1,932.0 | 2,419.0 | 1,528.7 | 1,760.2 | 2,026.8 | 2,333.7 | 2,687.1 |
| Account Receivables, % | 2.82 | 2.24 | 9.59 | 12.32 | 15.46 | 8.48 | 8.48 | 8.48 | 8.48 | 8.48 |
| Inventories | 1,006.7 | 1,966.3 | 1,958.6 | 2,013.1 | 2,072.9 | 2,328.5 | 2,681.2 | 3,087.2 | 3,554.7 | 4,093.0 |
| Inventories, % | 10.44 | 13.38 | 14.71 | 12.84 | 13.25 | 12.92 | 12.92 | 12.92 | 12.92 | 12.92 |
| Accounts Payable | 974.9 | 2,007.2 | 1,837.0 | 2,906.2 | 3,356.4 | 2,794.5 | 3,217.7 | 3,705.0 | 4,266.0 | 4,912.0 |
| Accounts Payable, % | 10.11 | 13.66 | 13.8 | 18.53 | 21.45 | 15.51 | 15.51 | 15.51 | 15.51 | 15.51 |
| Capital Expenditure | -1,151.5 | -1,446.5 | -4,179.8 | -5,376.9 | -3,131.7 | -3,873.3 | -4,459.8 | -5,135.2 | -5,912.8 | -6,808.2 |
| Capital Expenditure, % | -11.94 | -9.84 | -31.4 | -34.29 | -20.01 | -21.5 | -21.5 | -21.5 | -21.5 | -21.5 |
| Tax Rate, % | -46.73 | -46.73 | -46.73 | -46.73 | -46.73 | -46.73 | -46.73 | -46.73 | -46.73 | -46.73 |
| EBITAT | 1,938.4 | 4,266.3 | 1,232.5 | 1,863.7 | 724.4 | 2,726.7 | 3,139.6 | 3,615.1 | 4,162.5 | 4,792.8 |
| Depreciation | ||||||||||
| Changes in Account Receivables | ||||||||||
| Changes in Inventories | ||||||||||
| Changes in Accounts Payable | ||||||||||
| Capital Expenditure | ||||||||||
| UFCF | 1,419.4 | 3,798.0 | -3,018.8 | -1,930.0 | -911.9 | 441.0 | 263.2 | 303.0 | 348.9 | 401.7 |
| WACC, % | 7.36 | 7.34 | 7.42 | 7.38 | 7.54 | 7.41 | 7.41 | 7.41 | 7.41 | 7.41 |
| PV UFCF | ||||||||||
| SUM PV UFCF | 1,426.4 | |||||||||
| Long Term Growth Rate, % | 3.50 | |||||||||
| Free cash flow (T + 1) | 416 | |||||||||
| Terminal Value | 10,639 | |||||||||
| Present Terminal Value | 7,442 | |||||||||
| Enterprise Value | 8,869 | |||||||||
| Net Debt | 8,820 | |||||||||
| Equity Value | 49 | |||||||||
| Diluted Shares Outstanding, MM | 2,666 | |||||||||
| Equity Value Per Share | 0.02 |
What You Will Receive
- Customizable Excel Template: A fully adjustable Excel-based DCF Calculator featuring pre-populated financial data for Zhuzhou Kibing Group Co.,Ltd (601636SS).
- Comprehensive Data: Access to historical data and forward-looking projections (highlighted in the yellow cells).
- Assumption Flexibility: Adjust forecast parameters such as revenue growth, EBITDA margin, and WACC.
- Instant Calculations: Quickly observe how your inputs affect the valuation of Zhuzhou Kibing Group Co.,Ltd (601636SS).
- Professional Resource: Designed for investors, CFOs, consultants, and financial analysts.
- User-Friendly Interface: Organized for simplicity and ease of navigation, complete with step-by-step guidance.
Essential Features
- Actual Financial Data for Zhuzhou Kibing Group: Gain access to reliable pre-loaded historical figures and future forecasts.
- Adjustable Forecast Parameters: Modify the highlighted cells for WACC, growth rates, and profit margins.
- Real-Time Calculations: Automatic updates for DCF, Net Present Value (NPV), and cash flow evaluations.
- User-Friendly Dashboard: Clear charts and summaries that make it easy to interpret your valuation findings.
- Designed for All Skill Levels: An intuitive layout tailored for investors, CFOs, and consultants alike.
How It Works
- Step 1: Download the prebuilt Excel template featuring Zhuzhou Kibing Group Co., Ltd's (601636SS) data.
- Step 2: Navigate through the pre-filled sheets to familiarize yourself with the essential metrics.
- Step 3: Modify forecasts and assumptions in the editable yellow cells (WACC, growth, margins).
- Step 4: Instantly see the updated results, including the intrinsic value of Zhuzhou Kibing Group Co., Ltd (601636SS).
- Step 5: Use the outputs to make well-informed investment decisions or to create detailed reports.
Why Opt for This Calculator?
- All-in-One Solution: Features DCF, WACC, and comprehensive financial ratio analyses all in one tool.
- Flexible Customization: Modify the yellow-highlighted fields to explore different scenarios.
- In-Depth Analysis: Automatically computes the intrinsic value and Net Present Value for Zhuzhou Kibing Group Co., Ltd (601636SS).
- Preloaded Information: Historical and projected data provide a reliable foundation for analysis.
- High-Quality Output: Perfect for financial analysts, investors, and business advisors.
Who Should Utilize This Product?
- Investors: Make informed investment choices by accurately assessing the fair value of Zhuzhou Kibing Group Co., Ltd (601636SS).
- CFOs: Utilize a high-quality DCF model for comprehensive financial reporting and analysis.
- Consultants: Efficiently customize the template for client valuation reports.
- Entrepreneurs: Acquire knowledge of financial modeling practices employed by leading companies.
- Educators: Implement this resource as a teaching aid to illustrate valuation techniques.
Contents of the Template
- Preloaded ZHUB Data: Historical and forecasted financial information, including revenue, EBIT, and capital expenditures.
- DCF and WACC Models: High-quality spreadsheets for assessing intrinsic value and Weighted Average Cost of Capital.
- Editable Inputs: Yellow-highlighted cells for modifying revenue growth rates, tax rates, and discount rates.
- Financial Statements: Detailed annual and quarterly financial reports for in-depth analysis.
- Key Ratios: Metrics for profitability, leverage, and efficiency to assess performance.
- Dashboard and Charts: Visual representations of valuation outcomes and underlying assumptions.
Disclaimer
All information, articles, and product details provided on this website are for general informational and educational purposes only. We do not claim any ownership over, nor do we intend to infringe upon, any trademarks, copyrights, logos, brand names, or other intellectual property mentioned or depicted on this site. Such intellectual property remains the property of its respective owners, and any references here are made solely for identification or informational purposes, without implying any affiliation, endorsement, or partnership.
We make no representations or warranties, express or implied, regarding the accuracy, completeness, or suitability of any content or products presented. Nothing on this website should be construed as legal, tax, investment, financial, medical, or other professional advice. In addition, no part of this site—including articles or product references—constitutes a solicitation, recommendation, endorsement, advertisement, or offer to buy or sell any securities, franchises, or other financial instruments, particularly in jurisdictions where such activity would be unlawful.
All content is of a general nature and may not address the specific circumstances of any individual or entity. It is not a substitute for professional advice or services. Any actions you take based on the information provided here are strictly at your own risk. You accept full responsibility for any decisions or outcomes arising from your use of this website and agree to release us from any liability in connection with your use of, or reliance upon, the content or products found herein.