
|
Henan Mingtai al.industrial Co., Ltd. (601677.SS) DCF -Bewertung |
Fully Editable: Tailor To Your Needs In Excel Or Sheets
Professional Design: Trusted, Industry-Standard Templates
Investor-Approved Valuation Models
MAC/PC Compatible, Fully Unlocked
No Expertise Is Needed; Easy To Follow
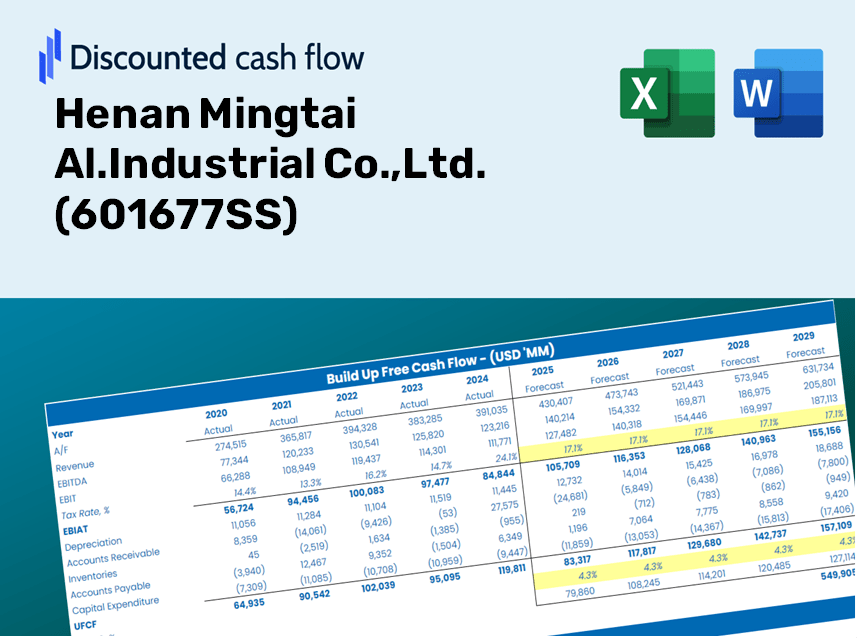
Henan Mingtai Al.Industrial Co.,Ltd. (601677.SS) Bundle
Erforschen Sie die finanziellen Aussichten von Henan Mingtai AL. Industrial Co., Ltd. (601677Ss) mit unserem benutzerfreundlichen DCF-Taschenrechner! Geben Sie Ihre Annahmen in Bezug auf Wachstum, Margen und Kosten ein, um den inneren Wert von Henan Mingtai AL zu berechnen. Industrial Co., Ltd. (601677) und Ihre Anlagestrategie verfeinern.
Discounted Cash Flow (DCF) - (USD MM)
| Year | AY1 2020 |
AY2 2021 |
AY3 2022 |
AY4 2023 |
AY5 2024 |
FY1 2025 |
FY2 2026 |
FY3 2027 |
FY4 2028 |
FY5 2029 |
|---|---|---|---|---|---|---|---|---|---|---|
| Revenue | 16,333.4 | 24,612.6 | 27,781.1 | 26,442.2 | 32,320.9 | 38,863.8 | 46,731.3 | 56,191.4 | 67,566.7 | 81,244.6 |
| Revenue Growth, % | 0 | 50.69 | 12.87 | -4.82 | 22.23 | 20.24 | 20.24 | 20.24 | 20.24 | 20.24 |
| EBITDA | 1,698.6 | 2,616.6 | 2,564.2 | 2,125.0 | 2,645.2 | 3,612.9 | 4,344.2 | 5,223.7 | 6,281.1 | 7,552.7 |
| EBITDA, % | 10.4 | 10.63 | 9.23 | 8.04 | 8.18 | 9.3 | 9.3 | 9.3 | 9.3 | 9.3 |
| Depreciation | 390.3 | 433.8 | 532.2 | 661.1 | 695.7 | 833.3 | 1,002.0 | 1,204.8 | 1,448.7 | 1,741.9 |
| Depreciation, % | 2.39 | 1.76 | 1.92 | 2.5 | 2.15 | 2.14 | 2.14 | 2.14 | 2.14 | 2.14 |
| EBIT | 1,308.3 | 2,182.8 | 2,032.0 | 1,463.9 | 1,949.5 | 2,779.6 | 3,342.3 | 4,018.9 | 4,832.5 | 5,810.7 |
| EBIT, % | 8.01 | 8.87 | 7.31 | 5.54 | 6.03 | 7.15 | 7.15 | 7.15 | 7.15 | 7.15 |
| Total Cash | 3,605.4 | 5,052.4 | 3,261.8 | 4,116.8 | 4,354.2 | 6,481.2 | 7,793.2 | 9,370.8 | 11,267.8 | 13,548.9 |
| Total Cash, percent | .0 | .0 | .0 | .0 | .0 | .0 | .0 | .0 | .0 | .0 |
| Account Receivables | 1,889.3 | 3,018.0 | 3,568.7 | 4,031.0 | 4,782.9 | 5,185.8 | 6,235.6 | 7,497.9 | 9,015.8 | 10,840.9 |
| Account Receivables, % | 11.57 | 12.26 | 12.85 | 15.24 | 14.8 | 13.34 | 13.34 | 13.34 | 13.34 | 13.34 |
| Inventories | 2,362.0 | 3,724.2 | 3,866.6 | 4,139.9 | 4,963.6 | 5,792.6 | 6,965.2 | 8,375.2 | 10,070.7 | 12,109.4 |
| Inventories, % | 14.46 | 15.13 | 13.92 | 15.66 | 15.36 | 14.9 | 14.9 | 14.9 | 14.9 | 14.9 |
| Accounts Payable | 1,641.1 | 3,683.4 | 2,644.7 | 854.5 | 2,827.5 | 3,615.3 | 4,347.2 | 5,227.3 | 6,285.4 | 7,557.8 |
| Accounts Payable, % | 10.05 | 14.97 | 9.52 | 3.23 | 8.75 | 9.3 | 9.3 | 9.3 | 9.3 | 9.3 |
| Capital Expenditure | -356.6 | -409.7 | -181.2 | -213.8 | -450.0 | -520.9 | -626.3 | -753.1 | -905.5 | -1,088.9 |
| Capital Expenditure, % | -2.18 | -1.66 | -0.65224 | -0.80864 | -1.39 | -1.34 | -1.34 | -1.34 | -1.34 | -1.34 |
| Tax Rate, % | 9.94 | 9.94 | 9.94 | 9.94 | 9.94 | 9.94 | 9.94 | 9.94 | 9.94 | 9.94 |
| EBITAT | 1,075.6 | 1,887.4 | 1,665.9 | 1,352.1 | 1,755.7 | 2,407.6 | 2,895.0 | 3,481.1 | 4,185.8 | 5,033.1 |
| Depreciation | ||||||||||
| Changes in Account Receivables | ||||||||||
| Changes in Inventories | ||||||||||
| Changes in Accounts Payable | ||||||||||
| Capital Expenditure | ||||||||||
| UFCF | -1,500.8 | 1,462.9 | 285.1 | -726.5 | 2,398.9 | 2,275.9 | 1,780.1 | 2,140.5 | 2,573.8 | 3,094.8 |
| WACC, % | 7.45 | 7.47 | 7.45 | 7.49 | 7.48 | 7.47 | 7.47 | 7.47 | 7.47 | 7.47 |
| PV UFCF | ||||||||||
| SUM PV UFCF | 9,472.4 | |||||||||
| Long Term Growth Rate, % | 2.00 | |||||||||
| Free cash flow (T + 1) | 3,157 | |||||||||
| Terminal Value | 57,741 | |||||||||
| Present Terminal Value | 40,282 | |||||||||
| Enterprise Value | 49,755 | |||||||||
| Net Debt | -974 | |||||||||
| Equity Value | 50,729 | |||||||||
| Diluted Shares Outstanding, MM | 1,258 | |||||||||
| Equity Value Per Share | 40.33 |
Benefits You Will Enjoy
- Comprehensive 601677SS Financials: Access historical and projected data for precise evaluations.
- Customizable Parameters: Adjust WACC, tax rates, revenue growth, and capital expenditures to fit your analysis.
- Automated Calculations: Instantly compute intrinsic value and NPV with real-time data.
- Scenario Planning: Explore various scenarios to assess the future performance of Henan Mingtai Al. Industrial Co.,Ltd.
- User-Friendly Interface: Designed for industry professionals while remaining approachable for newcomers.
Core Features
- Accurate Financial Insights: Gain access to reliable pre-loaded historical data and future forecasts for Henan Mingtai Al. Industrial Co., Ltd. (601677SS).
- Adjustable Forecast Parameters: Modify highlighted cells to tailor your analysis, including values like WACC, growth rates, and profit margins.
- Automated Calculations: Enjoy real-time updates for DCF, Net Present Value (NPV), and cash flow evaluations.
- Interactive Visual Dashboard: Utilize clear charts and summaries to illustrate your valuation outcomes effectively.
- Designed for All Levels: A user-friendly layout suitable for investors, CFOs, and consultants alike.
How It Operates
- 1. Access the Template: Download and open the Excel file featuring Henan Mingtai Al. Industrial Co., Ltd.'s (601677SS) preloaded data.
- 2. Adjust Assumptions: Modify essential inputs such as growth rates, WACC, and capital expenditures specific to Henan Mingtai Al. (601677SS).
- 3. View Real-Time Results: The DCF model automatically computes intrinsic value and NPV as you make adjustments.
- 4. Evaluate Scenarios: Analyze various forecasts to explore different valuation possibilities for Henan Mingtai Al. (601677SS).
- 5. Utilize with Assurance: Deliver professional valuation insights to back your strategic decisions regarding Henan Mingtai Al. (601677SS).
Why Opt for This Calculator?
- Designed for Experts: A sophisticated tool tailored for financial analysts, CFOs, and industry consultants.
- Comprehensive Data: Mingtai's historical and forecasted financial information is preloaded for enhanced accuracy.
- Forecast Simulations: Effortlessly model various scenarios and assumptions.
- Insightful Outputs: Instantly computes intrinsic value, NPV, and essential financial metrics.
- User-Friendly: Step-by-step guidance takes you through every stage of the process.
Who Can Benefit from Henan Mingtai Al. Industrial Co., Ltd. (601677SS)?
- Investors: Gain assurance in your investment choices with our reliable and comprehensive aluminum products.
- Manufacturing Professionals: Streamline your operations with high-quality aluminum solutions that are tailored to your needs.
- Consultants: Effortlessly customize our offerings for client proposals or project specifications.
- Industry Enthusiasts: Enhance your knowledge of aluminum applications through practical, real-life examples.
- Educators and Students: Leverage our resources as a hands-on learning tool in materials science and engineering courses.
Contents of the Template
- Historical Data: Provides a comprehensive overview of Henan Mingtai Al. Industrial Co., Ltd.'s past financial performance and foundational forecasts.
- DCF and Levered DCF Models: In-depth templates for assessing the intrinsic value of Henan Mingtai Al. Industrial Co., Ltd. (601677SS).
- WACC Sheet: Pre-configured calculations for the Weighted Average Cost of Capital.
- Editable Inputs: Customize essential parameters such as growth rates, EBITDA %, and CAPEX assumptions.
- Quarterly and Annual Statements: A thorough analysis of Henan Mingtai Al. Industrial Co., Ltd.'s financial statements.
- Interactive Dashboard: Dynamically visualize valuation outcomes and forecasts.
Disclaimer
All information, articles, and product details provided on this website are for general informational and educational purposes only. We do not claim any ownership over, nor do we intend to infringe upon, any trademarks, copyrights, logos, brand names, or other intellectual property mentioned or depicted on this site. Such intellectual property remains the property of its respective owners, and any references here are made solely for identification or informational purposes, without implying any affiliation, endorsement, or partnership.
We make no representations or warranties, express or implied, regarding the accuracy, completeness, or suitability of any content or products presented. Nothing on this website should be construed as legal, tax, investment, financial, medical, or other professional advice. In addition, no part of this site—including articles or product references—constitutes a solicitation, recommendation, endorsement, advertisement, or offer to buy or sell any securities, franchises, or other financial instruments, particularly in jurisdictions where such activity would be unlawful.
All content is of a general nature and may not address the specific circumstances of any individual or entity. It is not a substitute for professional advice or services. Any actions you take based on the information provided here are strictly at your own risk. You accept full responsibility for any decisions or outcomes arising from your use of this website and agree to release us from any liability in connection with your use of, or reliance upon, the content or products found herein.