
|
Jihua Group Corporation Limited (601718.SS) DCF -Bewertung |
Fully Editable: Tailor To Your Needs In Excel Or Sheets
Professional Design: Trusted, Industry-Standard Templates
Investor-Approved Valuation Models
MAC/PC Compatible, Fully Unlocked
No Expertise Is Needed; Easy To Follow
Jihua Group Corporation Limited (601718.SS) Bundle
Entdecken Sie die finanzielle Zukunft der Jihua Group Corporation Limited (601718SS) mit unserem benutzerfreundlichen DCF-Taschenrechner! Geben Sie Ihre Annahmen in Bezug auf Wachstumsraten, Gewinnmargen und Ausgaben ein, um den inneren Wert der Jihua Group Corporation Limited (601718S) zu berechnen und Ihre Anlagestrategie zu verbessern.
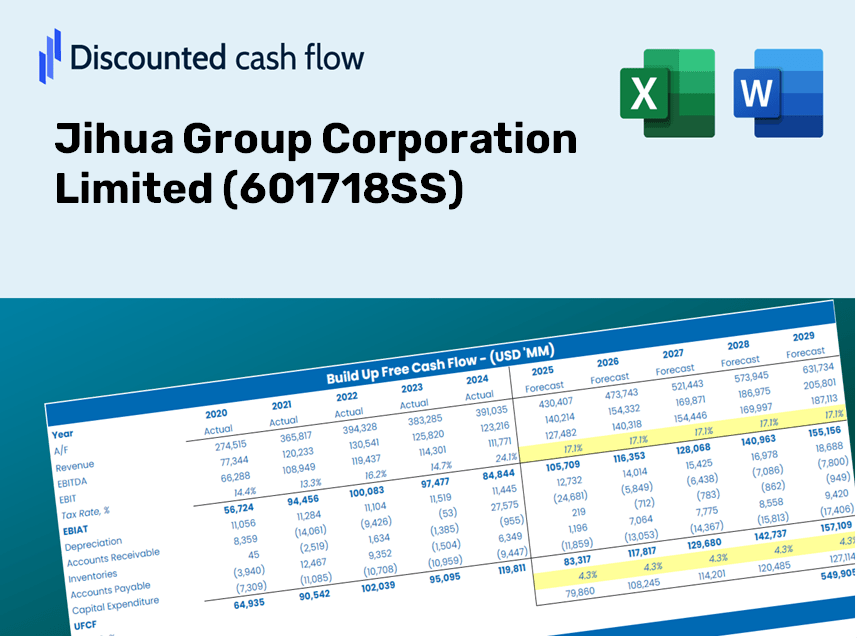
Discounted Cash Flow (DCF) - (USD MM)
| Year | AY1 2020 |
AY2 2021 |
AY3 2022 |
AY4 2023 |
AY5 2024 |
FY1 2025 |
FY2 2026 |
FY3 2027 |
FY4 2028 |
FY5 2029 |
|---|---|---|---|---|---|---|---|---|---|---|
| Revenue | 14,953.7 | 15,494.0 | 15,435.8 | 11,560.7 | 9,886.1 | 8,987.6 | 8,170.8 | 7,428.3 | 6,753.2 | 6,139.4 |
| Revenue Growth, % | 0 | 3.61 | -0.37568 | -25.1 | -14.49 | -9.09 | -9.09 | -9.09 | -9.09 | -9.09 |
| EBITDA | 282.8 | 366.8 | 801.6 | 694.0 | -3,852.2 | -422.6 | -384.2 | -349.3 | -317.5 | -288.7 |
| EBITDA, % | 1.89 | 2.37 | 5.19 | 6 | -38.97 | -4.7 | -4.7 | -4.7 | -4.7 | -4.7 |
| Depreciation | 456.3 | 412.1 | 421.6 | 390.3 | 392.0 | 283.7 | 257.9 | 234.5 | 213.2 | 193.8 |
| Depreciation, % | 3.05 | 2.66 | 2.73 | 3.38 | 3.96 | 3.16 | 3.16 | 3.16 | 3.16 | 3.16 |
| EBIT | -173.5 | -45.3 | 380.0 | 303.7 | -4,244.1 | -706.3 | -642.1 | -583.8 | -530.7 | -482.5 |
| EBIT, % | -1.16 | -0.29223 | 2.46 | 2.63 | -42.93 | -7.86 | -7.86 | -7.86 | -7.86 | -7.86 |
| Total Cash | 7,138.2 | 6,653.9 | 5,489.6 | 6,776.3 | 5,606.8 | 4,342.3 | 3,947.7 | 3,588.9 | 3,262.8 | 2,966.2 |
| Total Cash, percent | .0 | .0 | .0 | .0 | .0 | .0 | .0 | .0 | .0 | .0 |
| Account Receivables | 7,149.4 | 2,209.9 | 5,313.2 | 4,414.9 | 3,650.9 | 3,084.8 | 2,804.4 | 2,549.6 | 2,317.9 | 2,107.2 |
| Account Receivables, % | 47.81 | 14.26 | 34.42 | 38.19 | 36.93 | 34.32 | 34.32 | 34.32 | 34.32 | 34.32 |
| Inventories | 3,441.5 | 3,784.5 | 4,600.1 | 4,133.7 | 2,623.4 | 2,508.1 | 2,280.2 | 2,073.0 | 1,884.6 | 1,713.3 |
| Inventories, % | 23.01 | 24.43 | 29.8 | 35.76 | 26.54 | 27.91 | 27.91 | 27.91 | 27.91 | 27.91 |
| Accounts Payable | 3,483.2 | 1,708.0 | 2,665.6 | 3,667.6 | 1,947.5 | 1,851.7 | 1,683.4 | 1,530.4 | 1,391.3 | 1,264.9 |
| Accounts Payable, % | 23.29 | 11.02 | 17.27 | 31.73 | 19.7 | 20.6 | 20.6 | 20.6 | 20.6 | 20.6 |
| Capital Expenditure | -603.5 | -646.1 | -578.4 | -1,865.9 | -649.3 | -623.0 | -566.4 | -514.9 | -468.1 | -425.6 |
| Capital Expenditure, % | -4.04 | -4.17 | -3.75 | -16.14 | -6.57 | -6.93 | -6.93 | -6.93 | -6.93 | -6.93 |
| Tax Rate, % | 1.69 | 1.69 | 1.69 | 1.69 | 1.69 | 1.69 | 1.69 | 1.69 | 1.69 | 1.69 |
| EBITAT | -172.9 | -55.2 | 384.9 | 255.7 | -4,172.4 | -681.1 | -619.2 | -562.9 | -511.8 | -465.3 |
| Depreciation | ||||||||||
| Changes in Account Receivables | ||||||||||
| Changes in Inventories | ||||||||||
| Changes in Accounts Payable | ||||||||||
| Capital Expenditure | ||||||||||
| UFCF | -7,427.7 | 2,532.1 | -2,733.2 | 1,146.8 | -3,875.5 | -435.0 | -587.7 | -534.3 | -485.7 | -441.6 |
| WACC, % | 5.76 | 5.76 | 5.76 | 5.71 | 5.76 | 5.75 | 5.75 | 5.75 | 5.75 | 5.75 |
| PV UFCF | ||||||||||
| SUM PV UFCF | -2,110.9 | |||||||||
| Long Term Growth Rate, % | 3.50 | |||||||||
| Free cash flow (T + 1) | -457 | |||||||||
| Terminal Value | -20,312 | |||||||||
| Present Terminal Value | -15,358 | |||||||||
| Enterprise Value | -17,469 | |||||||||
| Net Debt | -4,150 | |||||||||
| Equity Value | -13,319 | |||||||||
| Diluted Shares Outstanding, MM | 4,404 | |||||||||
| Equity Value Per Share | -3.02 |
What You Will Receive
- Authentic Jihua Data: Comprehensive financials – from revenue to EBIT – utilizing both historical and projected figures.
- Complete Customization: Tailor all essential parameters (yellow cells) such as WACC, growth %, and tax rates to fit your analysis.
- Immediate Valuation Adjustments: Automated recalculations to evaluate the effects of modifications on Jihua Group's fair value.
- Flexible Excel Template: Designed for quick adjustments, scenario evaluations, and thorough projections.
- Efficient and Precise: Avoid starting from the ground up while ensuring accuracy and adaptability.
Key Features
- Comprehensive DCF Calculator: Features detailed unlevered and levered DCF valuation models tailored for Jihua Group Corporation Limited (601718SS).
- WACC Calculator: Offers a pre-built Weighted Average Cost of Capital sheet with editable inputs specific to Jihua Group Corporation Limited (601718SS).
- Customizable Forecast Assumptions: Adjust parameters such as growth rates, capital expenditures, and discount rates for Jihua Group Corporation Limited (601718SS).
- Integrated Financial Ratios: Evaluate profitability, leverage, and efficiency ratios specifically for Jihua Group Corporation Limited (601718SS).
- Interactive Dashboard and Charts: Visual representations that summarize essential valuation metrics for quick and efficient analysis of Jihua Group Corporation Limited (601718SS).
How It Works
- Step 1: Download the Excel file.
- Step 2: Review Jihua Group Corporation Limited's (601718SS) pre-filled financial data and forecasts.
- Step 3: Adjust key inputs such as revenue growth, WACC, and tax rates (highlighted cells).
- Step 4: Observe the DCF model update in real-time as you modify your assumptions.
- Step 5: Evaluate the outputs and utilize the results for your investment strategies.
Why Choose This Calculator for Jihua Group Corporation Limited (601718SS)?
- Reliable Data: Utilize authentic financial information from Jihua Group for dependable valuation outcomes.
- Customizable Options: Modify essential variables such as growth rates, WACC, and tax rates to align with your forecasts.
- Efficiency Boost: Ready-to-use calculations save you the hassle of building models from the ground up.
- Professional-Grade Resource: Tailored for investors, analysts, and consultants in the field.
- Easy to Use: Its intuitive design and clear step-by-step guidance make it accessible for all users.
Who Can Benefit from Jihua Group Corporation Limited's Services?
- Finance Students: Understand and apply valuation methods using real-time data specific to (601718SS).
- Academics: Integrate professional financial models into your academic research or lessons.
- Investors: Validate your theories and assess valuation results for Jihua Group Corporation Limited (601718SS).
- Analysts: Enhance your efficiency with our ready-to-use, customizable DCF model tailored for (601718SS).
- Small Business Owners: Discover the analytical approaches used for evaluating large public companies like Jihua Group Corporation Limited (601718SS).
Contents of the Template
- Preloaded Jihua Group Data: Historical and projected financial metrics, such as revenue, EBIT, and capital expenditures.
- DCF and WACC Models: Advanced spreadsheets for determining intrinsic value and Weighted Average Cost of Capital.
- Editable Inputs: Yellow-highlighted fields for modifying revenue growth, tax rates, and discount rates.
- Financial Statements: Detailed annual and quarterly financial reports for in-depth analysis.
- Key Ratios: Profitability, leverage, and efficiency ratios for performance assessment.
- Dashboard and Charts: Visual representations of valuation results and underlying assumptions.
Disclaimer
All information, articles, and product details provided on this website are for general informational and educational purposes only. We do not claim any ownership over, nor do we intend to infringe upon, any trademarks, copyrights, logos, brand names, or other intellectual property mentioned or depicted on this site. Such intellectual property remains the property of its respective owners, and any references here are made solely for identification or informational purposes, without implying any affiliation, endorsement, or partnership.
We make no representations or warranties, express or implied, regarding the accuracy, completeness, or suitability of any content or products presented. Nothing on this website should be construed as legal, tax, investment, financial, medical, or other professional advice. In addition, no part of this site—including articles or product references—constitutes a solicitation, recommendation, endorsement, advertisement, or offer to buy or sell any securities, franchises, or other financial instruments, particularly in jurisdictions where such activity would be unlawful.
All content is of a general nature and may not address the specific circumstances of any individual or entity. It is not a substitute for professional advice or services. Any actions you take based on the information provided here are strictly at your own risk. You accept full responsibility for any decisions or outcomes arising from your use of this website and agree to release us from any liability in connection with your use of, or reliance upon, the content or products found herein.