
|
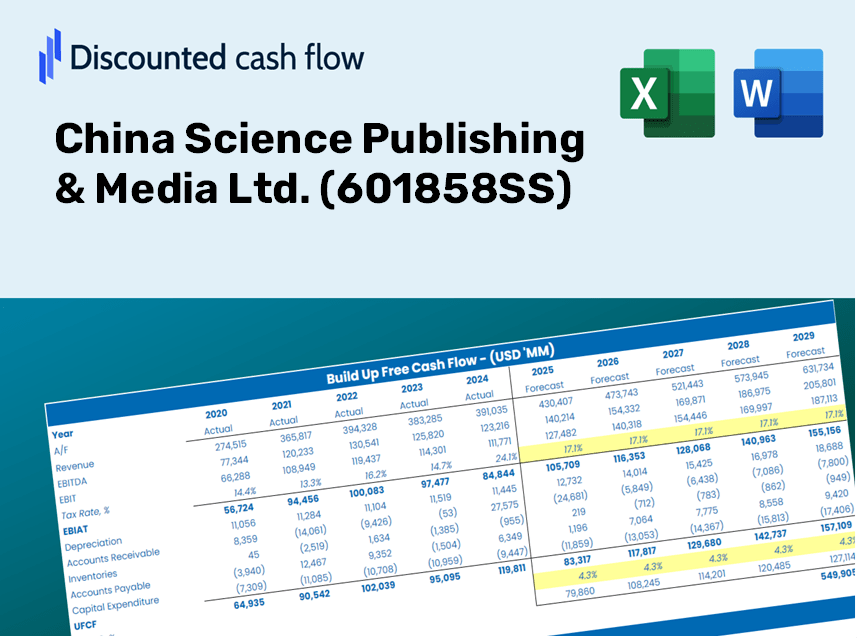
China Science Publishing & Media Ltd. (601858.SS) DCF -Bewertung |
Fully Editable: Tailor To Your Needs In Excel Or Sheets
Professional Design: Trusted, Industry-Standard Templates
Investor-Approved Valuation Models
MAC/PC Compatible, Fully Unlocked
No Expertise Is Needed; Easy To Follow
China Science Publishing & Media Ltd. (601858.SS) Bundle
Ich möchte den inneren Wert des China Science Publishing bewerten & Media Ltd.? Unser DCF-Taschenrechner (601858S) integriert reale Daten mit umfassenden Anpassungsfunktionen, mit denen Sie Ihre Prognosen verfeinern und Ihre Anlagestrategien verbessern können.
What You Will Receive
- Real CSMP Financial Data: Pre-loaded with China Science Publishing & Media’s historical and projected figures for accurate assessment.
- Completely Customizable Template: Easily adjust key inputs such as revenue growth, WACC, and EBITDA percentage.
- Instant Calculations: Watch as the intrinsic value of CSMP updates in real-time based on your modifications.
- Professional Valuation Tool: Tailored for investors, analysts, and consultants who demand precise DCF results.
- User-Friendly Interface: Organized layout and straightforward instructions suited for all skill levels.
Essential Features
- Pre-Loaded Data: Comprehensive historical financial records and pre-set forecasts for China Science Publishing & Media Ltd. (601858SS).
- Fully Customizable Inputs: Adjust parameters such as WACC, tax rates, revenue growth, and EBITDA margins as needed.
- Real-Time Results: Instantly view the recalculated intrinsic value for China Science Publishing & Media Ltd. (601858SS).
- Clear Visual Outputs: Dashboard visualizations present valuation results and key metrics effectively.
- Designed for Accuracy: A robust tool tailored for analysts, investors, and finance professionals.
How It Functions
- 1. Access the Template: Download and open the Excel file containing China Science Publishing & Media Ltd.’s (601858SS) preloaded data.
- 2. Modify Key Assumptions: Adjust essential inputs such as growth rates, WACC, and capital expenditures.
- 3. View Results in Real-Time: The DCF model automatically computes intrinsic value and NPV based on your inputs.
- 4. Experiment with Scenarios: Analyze various forecasts to evaluate different valuation results.
- 5. Present with Assurance: Deliver professional valuation insights to back your strategic decisions.
Why Choose This Calculator for China Science Publishing & Media Ltd. (601858SS)?
- All-in-One Solution: Combines DCF, WACC, and comprehensive financial ratio analyses into a single tool.
- Flexible Parameters: Modify the yellow-highlighted cells to explore different financial scenarios.
- In-Depth Analysis: Automatically computes the intrinsic value and Net Present Value for China Science Publishing & Media Ltd. (601858SS).
- Loaded with Data: Features historical and projected data for precise benchmark calculations.
- Expert-Level Quality: Perfect for financial analysts, investors, and business advisors focused on (601858SS).
Who Can Benefit from This Product?
- Professional Investors: Develop comprehensive and trustworthy valuation models for analyzing investments in China Science Publishing & Media Ltd. (601858SS).
- Corporate Finance Teams: Evaluate valuation scenarios to inform strategic decisions within the organization.
- Consultants and Advisors: Deliver precise valuation insights to clients regarding China Science Publishing & Media Ltd. (601858SS).
- Students and Educators: Utilize real-world data to refine skills and teach financial modeling concepts.
- Media Industry Enthusiasts: Gain insights into the market valuation of leading companies like China Science Publishing & Media Ltd. (601858SS).
Contents of the Template
- Preloaded 601858SS Data: Historical and projected financial metrics, including revenue, EBIT, and capital expenditures.
- DCF and WACC Models: Advanced sheets designed for calculating intrinsic value and Weighted Average Cost of Capital.
- Editable Inputs: Cells highlighted in yellow for customizing revenue growth, tax rates, and discount rates.
- Financial Statements: Detailed annual and quarterly financials for thorough analysis.
- Key Ratios: Profitability, leverage, and efficiency ratios for performance evaluation.
- Dashboard and Charts: Visual representations of valuation outcomes and underlying assumptions.
Disclaimer
All information, articles, and product details provided on this website are for general informational and educational purposes only. We do not claim any ownership over, nor do we intend to infringe upon, any trademarks, copyrights, logos, brand names, or other intellectual property mentioned or depicted on this site. Such intellectual property remains the property of its respective owners, and any references here are made solely for identification or informational purposes, without implying any affiliation, endorsement, or partnership.
We make no representations or warranties, express or implied, regarding the accuracy, completeness, or suitability of any content or products presented. Nothing on this website should be construed as legal, tax, investment, financial, medical, or other professional advice. In addition, no part of this site—including articles or product references—constitutes a solicitation, recommendation, endorsement, advertisement, or offer to buy or sell any securities, franchises, or other financial instruments, particularly in jurisdictions where such activity would be unlawful.
All content is of a general nature and may not address the specific circumstances of any individual or entity. It is not a substitute for professional advice or services. Any actions you take based on the information provided here are strictly at your own risk. You accept full responsibility for any decisions or outcomes arising from your use of this website and agree to release us from any liability in connection with your use of, or reliance upon, the content or products found herein.