
|
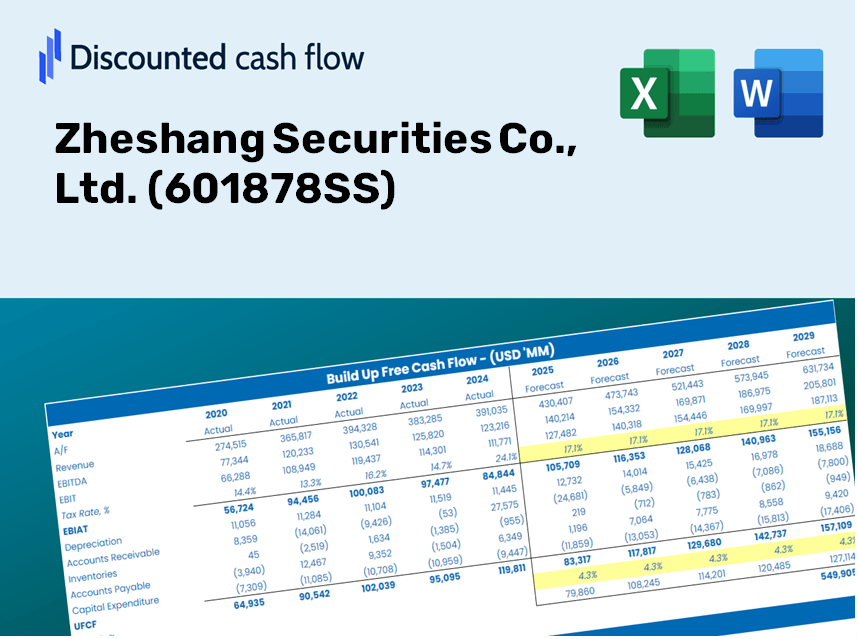
ZhesHang Securities Co., Ltd. (601878.SS) DCF -Bewertung |
Fully Editable: Tailor To Your Needs In Excel Or Sheets
Professional Design: Trusted, Industry-Standard Templates
Investor-Approved Valuation Models
MAC/PC Compatible, Fully Unlocked
No Expertise Is Needed; Easy To Follow
Zheshang Securities Co., Ltd. (601878.SS) Bundle
Unsere ZhesHang Securities Co., Ltd. (601878S), die für die Genauigkeit entwickelt wurde, hilft Ihnen bei der Bewertung der Bewertung des Unternehmens anhand von Finanzdaten mit realer Welt und bietet eine vollständige Flexibilität, um alle wesentlichen Parameter für erweiterte Projektionen zu ändern.
Discounted Cash Flow (DCF) - (USD MM)
| Year | AY1 2020 |
AY2 2021 |
AY3 2022 |
AY4 2023 |
AY5 2024 |
FY1 2025 |
FY2 2026 |
FY3 2027 |
FY4 2028 |
FY5 2029 |
|---|---|---|---|---|---|---|---|---|---|---|
| Revenue | 10,572.4 | 16,384.8 | 16,767.7 | 17,578.9 | 15,756.3 | 17,796.1 | 20,100.0 | 22,702.1 | 25,641.2 | 28,960.7 |
| Revenue Growth, % | 0 | 54.98 | 2.34 | 4.84 | -10.37 | 12.95 | 12.95 | 12.95 | 12.95 | 12.95 |
| EBITDA | 3,526.4 | 4,448.1 | 2,394.9 | -7,666.4 | .0 | 1,109.5 | 1,253.2 | 1,415.4 | 1,598.7 | 1,805.6 |
| EBITDA, % | 33.36 | 27.15 | 14.28 | -43.61 | 0 | 6.23 | 6.23 | 6.23 | 6.23 | 6.23 |
| Depreciation | 137.6 | 275.8 | 297.3 | 321.0 | 359.1 | 315.4 | 356.3 | 402.4 | 454.5 | 513.3 |
| Depreciation, % | 1.3 | 1.68 | 1.77 | 1.83 | 2.28 | 1.77 | 1.77 | 1.77 | 1.77 | 1.77 |
| EBIT | 3,388.8 | 4,172.2 | 2,097.6 | -7,987.4 | -359.1 | 794.1 | 896.9 | 1,013.0 | 1,144.2 | 1,292.3 |
| EBIT, % | 32.05 | 25.46 | 12.51 | -45.44 | -2.28 | 4.46 | 4.46 | 4.46 | 4.46 | 4.46 |
| Total Cash | 48,669.7 | 67,597.8 | 78,525.0 | 76,873.1 | 84,972.2 | 17,796.1 | 20,100.0 | 22,702.1 | 25,641.2 | 28,960.7 |
| Total Cash, percent | .0 | .0 | .0 | .0 | .0 | .0 | .0 | .0 | .0 | .0 |
| Account Receivables | 269.3 | 319.1 | 20,542.0 | 25,323.0 | 27,848.5 | 10,837.6 | 12,240.7 | 13,825.4 | 15,615.2 | 17,636.8 |
| Account Receivables, % | 2.55 | 1.95 | 122.51 | 144.05 | 176.75 | 60.9 | 60.9 | 60.9 | 60.9 | 60.9 |
| Inventories | .0 | 369.3 | 603.9 | 1,303.9 | .0 | 472.4 | 533.6 | 602.6 | 680.7 | 768.8 |
| Inventories, % | 0 | 2.25 | 3.6 | 7.42 | 0 | 2.65 | 2.65 | 2.65 | 2.65 | 2.65 |
| Accounts Payable | 109.0 | 372.1 | 190.4 | 694.6 | 576.5 | 428.8 | 484.3 | 547.0 | 617.9 | 697.8 |
| Accounts Payable, % | 1.03 | 2.27 | 1.14 | 3.95 | 3.66 | 2.41 | 2.41 | 2.41 | 2.41 | 2.41 |
| Capital Expenditure | -223.7 | -254.3 | -248.9 | -244.4 | -286.5 | -297.6 | -336.1 | -379.6 | -428.7 | -484.2 |
| Capital Expenditure, % | -2.12 | -1.55 | -1.48 | -1.39 | -1.82 | -1.67 | -1.67 | -1.67 | -1.67 | -1.67 |
| Tax Rate, % | 20.33 | 20.33 | 20.33 | 20.33 | 20.33 | 20.33 | 20.33 | 20.33 | 20.33 | 20.33 |
| EBITAT | 2,545.7 | 3,141.2 | 1,654.2 | -6,361.9 | -286.1 | 617.1 | 697.0 | 787.3 | 889.2 | 1,004.3 |
| Depreciation | ||||||||||
| Changes in Account Receivables | ||||||||||
| Changes in Inventories | ||||||||||
| Changes in Accounts Payable | ||||||||||
| Capital Expenditure | ||||||||||
| UFCF | 2,299.3 | 3,006.7 | -18,936.6 | -11,262.0 | -1,553.2 | 17,025.8 | -691.4 | -781.0 | -882.1 | -996.3 |
| WACC, % | 6.32 | 6.33 | 6.4 | 6.42 | 6.42 | 6.38 | 6.38 | 6.38 | 6.38 | 6.38 |
| PV UFCF | ||||||||||
| SUM PV UFCF | 13,325.0 | |||||||||
| Long Term Growth Rate, % | 2.00 | |||||||||
| Free cash flow (T + 1) | -1,016 | |||||||||
| Terminal Value | -23,203 | |||||||||
| Present Terminal Value | -17,032 | |||||||||
| Enterprise Value | -3,707 | |||||||||
| Net Debt | 14,591 | |||||||||
| Equity Value | -18,297 | |||||||||
| Diluted Shares Outstanding, MM | 4,200 | |||||||||
| Equity Value Per Share | -4.36 |
What You Will Receive
- Authentic Zheshang Data: Comprehensive financials – from revenue to EBIT – based on real and projected metrics.
- Complete Customization: Modify all essential parameters (yellow cells) such as WACC, growth %, and tax rates.
- Immediate Valuation Adjustments: Automatic recalculations to evaluate the effects of changes on Zheshang Securities’ fair value.
- Flexible Excel Template: Designed for easy edits, scenario analysis, and in-depth projections.
- Efficient and Precise: Avoid starting models from the ground up while ensuring accuracy and adaptability.
Key Features
- Comprehensive DCF Calculator: Features detailed unlevered and levered DCF valuation models tailored for Zheshang Securities Co., Ltd. (601878SS).
- WACC Calculator: Includes a pre-configured Weighted Average Cost of Capital sheet with adjustable parameters.
- Customizable Forecast Assumptions: Easily adjust growth rates, capital expenditures, and discount rates to suit your analysis.
- Integrated Financial Ratios: Evaluate profitability, leverage, and efficiency ratios specific to Zheshang Securities Co., Ltd. (601878SS).
- Visual Dashboard and Charts: Present key valuation metrics through intuitive visual outputs for straightforward analysis.
How It Functions
- Step 1: Download the Excel file.
- Step 2: Examine the pre-filled Zheshang Securities Co., Ltd. (601878SS) data (historical and projected).
- Step 3: Modify key assumptions (highlighted in yellow) according to your analysis.
- Step 4: Observe the automatic recalculations for Zheshang Securities Co., Ltd.'s intrinsic value.
- Step 5: Utilize the results for investment decisions or reporting purposes.
Why Opt for Zheshang Securities Calculator?
- Precision: Utilizes authentic financial data from Zheshang Securities for reliable results.
- Adaptability: Built to allow users to freely adjust and experiment with inputs.
- Efficient: Avoid the complexity of constructing a financial model from the ground up.
- Professional Quality: Crafted with the skill level and usability expected by CFOs.
- User-Centric: Intuitive and accessible, suitable for individuals with varying levels of financial expertise.
Who Can Benefit from Zheshang Securities Co., Ltd. (601878SS)?
- Investors: Gain assurance in your investment choices with our top-tier valuation tools.
- Financial Analysts: Enhance your efficiency with our ready-to-use DCF model, designed for easy customization.
- Consultants: Seamlessly modify our templates for impactful client presentations and comprehensive reports.
- Finance Enthusiasts: Expand your knowledge of valuation methods with practical, real-life applications.
- Educators and Students: Utilize our resources as a hands-on learning tool in finance courses.
Contents of the Template
- Preloaded ZHSS Data: Historical and projected financial information, including revenue, EBIT, and capital expenditures.
- DCF and WACC Models: Professional-grade spreadsheets designed to calculate intrinsic value and Weighted Average Cost of Capital.
- Editable Inputs: Yellow-highlighted cells for modifying revenue growth, tax rates, and discount rates.
- Financial Statements: Detailed annual and quarterly financials for in-depth analysis.
- Key Ratios: Metrics for profitability, leverage, and efficiency to assess performance.
- Dashboard and Charts: Visual representations of valuation results and underlying assumptions.
Disclaimer
All information, articles, and product details provided on this website are for general informational and educational purposes only. We do not claim any ownership over, nor do we intend to infringe upon, any trademarks, copyrights, logos, brand names, or other intellectual property mentioned or depicted on this site. Such intellectual property remains the property of its respective owners, and any references here are made solely for identification or informational purposes, without implying any affiliation, endorsement, or partnership.
We make no representations or warranties, express or implied, regarding the accuracy, completeness, or suitability of any content or products presented. Nothing on this website should be construed as legal, tax, investment, financial, medical, or other professional advice. In addition, no part of this site—including articles or product references—constitutes a solicitation, recommendation, endorsement, advertisement, or offer to buy or sell any securities, franchises, or other financial instruments, particularly in jurisdictions where such activity would be unlawful.
All content is of a general nature and may not address the specific circumstances of any individual or entity. It is not a substitute for professional advice or services. Any actions you take based on the information provided here are strictly at your own risk. You accept full responsibility for any decisions or outcomes arising from your use of this website and agree to release us from any liability in connection with your use of, or reliance upon, the content or products found herein.