
|
Jangho Group Co., Ltd. (601886.SS) DCF -Bewertung |
Fully Editable: Tailor To Your Needs In Excel Or Sheets
Professional Design: Trusted, Industry-Standard Templates
Investor-Approved Valuation Models
MAC/PC Compatible, Fully Unlocked
No Expertise Is Needed; Easy To Follow
Jangho Group Co., Ltd. (601886.SS) Bundle
Verbessern Sie Ihre Anlagestrategien mit dem DCF -Taschenrechner (601886S)! Verwenden Sie die tatsächlichen Finanzdaten von Jangho Group Co., Ltd., passen Sie Wachstumsprojektionen und -kosten an und beobachten Sie sofort, wie sich diese Modifikationen auf den inneren Wert von (601886SS) auswirken.
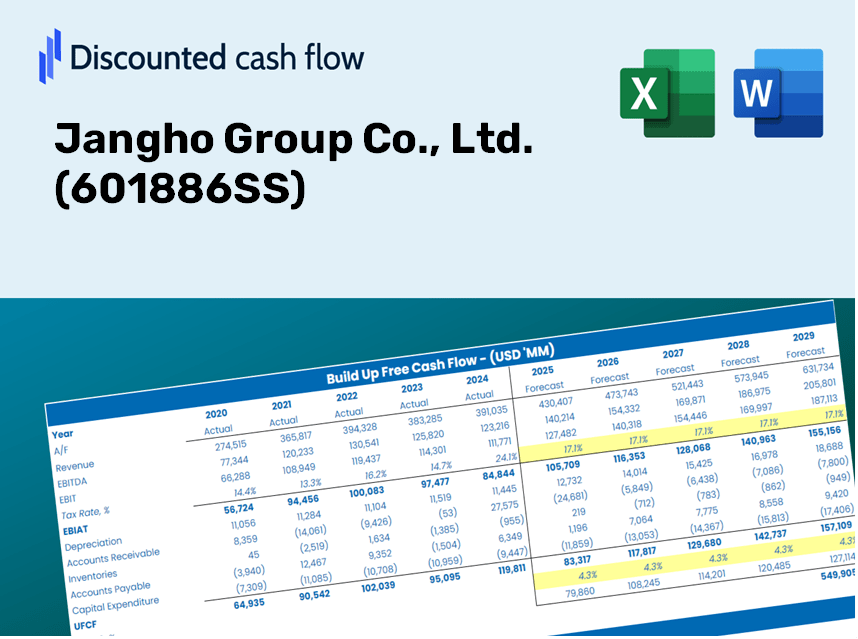
Discounted Cash Flow (DCF) - (USD MM)
| Year | AY1 2020 |
AY2 2021 |
AY3 2022 |
AY4 2023 |
AY5 2024 |
FY1 2025 |
FY2 2026 |
FY3 2027 |
FY4 2028 |
FY5 2029 |
|---|---|---|---|---|---|---|---|---|---|---|
| Revenue | 18,050.0 | 20,789.4 | 18,056.4 | 20,954.3 | 22,405.7 | 23,806.4 | 25,294.7 | 26,876.0 | 28,556.2 | 30,341.4 |
| Revenue Growth, % | 0 | 15.18 | -13.15 | 16.05 | 6.93 | 6.25 | 6.25 | 6.25 | 6.25 | 6.25 |
| EBITDA | 1,453.7 | -4.0 | 1,057.8 | 1,464.8 | 1,231.4 | 1,256.0 | 1,334.5 | 1,417.9 | 1,506.6 | 1,600.8 |
| EBITDA, % | 8.05 | -0.01904447 | 5.86 | 6.99 | 5.5 | 5.28 | 5.28 | 5.28 | 5.28 | 5.28 |
| Depreciation | 154.2 | 144.8 | 282.8 | 277.8 | 149.5 | 243.3 | 258.5 | 274.6 | 291.8 | 310.1 |
| Depreciation, % | 0.85418 | 0.69638 | 1.57 | 1.33 | 0.66725 | 1.02 | 1.02 | 1.02 | 1.02 | 1.02 |
| EBIT | 1,299.5 | -148.7 | 775.0 | 1,187.0 | 1,081.9 | 1,012.7 | 1,076.0 | 1,143.3 | 1,214.8 | 1,290.7 |
| EBIT, % | 7.2 | -0.71542 | 4.29 | 5.66 | 4.83 | 4.25 | 4.25 | 4.25 | 4.25 | 4.25 |
| Total Cash | 6,717.6 | 5,554.2 | 4,608.3 | 5,013.1 | 5,779.7 | 6,626.5 | 7,040.7 | 7,480.9 | 7,948.6 | 8,445.5 |
| Total Cash, percent | .0 | .0 | .0 | .0 | .0 | .0 | .0 | .0 | .0 | .0 |
| Account Receivables | 16,071.1 | 14,452.9 | 15,595.8 | 16,202.9 | 15,886.7 | 18,719.4 | 19,889.7 | 21,133.1 | 22,454.3 | 23,858.0 |
| Account Receivables, % | 89.04 | 69.52 | 86.37 | 77.32 | 70.9 | 78.63 | 78.63 | 78.63 | 78.63 | 78.63 |
| Inventories | 856.2 | 1,169.1 | 1,027.1 | 1,045.9 | 831.1 | 1,178.7 | 1,252.4 | 1,330.7 | 1,413.9 | 1,502.3 |
| Inventories, % | 4.74 | 5.62 | 5.69 | 4.99 | 3.71 | 4.95 | 4.95 | 4.95 | 4.95 | 4.95 |
| Accounts Payable | 13,950.5 | 14,827.6 | 10,029.1 | 9,974.9 | 15,151.6 | 15,206.7 | 16,157.3 | 17,167.4 | 18,240.7 | 19,381.0 |
| Accounts Payable, % | 77.29 | 71.32 | 55.54 | 47.6 | 67.62 | 63.88 | 63.88 | 63.88 | 63.88 | 63.88 |
| Capital Expenditure | -346.8 | -356.1 | -319.8 | -614.0 | -454.4 | -493.4 | -524.3 | -557.0 | -591.9 | -628.9 |
| Capital Expenditure, % | -1.92 | -1.71 | -1.77 | -2.93 | -2.03 | -2.07 | -2.07 | -2.07 | -2.07 | -2.07 |
| Tax Rate, % | 30.19 | 30.19 | 30.19 | 30.19 | 30.19 | 30.19 | 30.19 | 30.19 | 30.19 | 30.19 |
| EBITAT | 952.0 | -149.4 | 564.6 | 881.6 | 755.3 | 790.3 | 839.7 | 892.2 | 948.0 | 1,007.2 |
| Depreciation | ||||||||||
| Changes in Account Receivables | ||||||||||
| Changes in Inventories | ||||||||||
| Changes in Accounts Payable | ||||||||||
| Capital Expenditure | ||||||||||
| UFCF | -2,217.4 | 1,821.7 | -5,271.6 | -134.8 | 6,158.0 | -2,585.1 | 280.6 | 298.2 | 316.8 | 336.6 |
| WACC, % | 9.38 | 9.85 | 9.37 | 9.4 | 9.32 | 9.46 | 9.46 | 9.46 | 9.46 | 9.46 |
| PV UFCF | ||||||||||
| SUM PV UFCF | -1,465.2 | |||||||||
| Long Term Growth Rate, % | 3.00 | |||||||||
| Free cash flow (T + 1) | 347 | |||||||||
| Terminal Value | 5,365 | |||||||||
| Present Terminal Value | 3,414 | |||||||||
| Enterprise Value | 1,949 | |||||||||
| Net Debt | -3,065 | |||||||||
| Equity Value | 5,013 | |||||||||
| Diluted Shares Outstanding, MM | 1,139 | |||||||||
| Equity Value Per Share | 4.40 |
Benefits You Will Receive
- Comprehensive Financial Model: Leverage Jangho Group Co., Ltd.'s (601886SS) actual figures for accurate DCF valuation.
- Complete Forecast Control: Modify revenue growth, profit margins, WACC, and other pivotal drivers.
- Real-Time Calculations: Automatic updates provide immediate feedback as you adjust inputs.
- Professional-Grade Template: A polished Excel file crafted for expert-level valuation.
- Adaptable and Reusable: Designed for versatility, enabling repeated use for in-depth forecasting.
Key Features
- 🔍 Real-Life Jangho (601886SS) Financials: Pre-loaded historical and projected data for Jangho Group Co., Ltd.
- ✏️ Fully Customizable Inputs: Modify all essential parameters (yellow cells) such as WACC, growth %, and tax rates.
- 📊 Professional DCF Valuation: Integrated formulas determine Jangho’s intrinsic value using the Discounted Cash Flow method.
- ⚡ Instant Results: View Jangho’s valuation immediately after any adjustments.
- Scenario Analysis: Evaluate and compare results for various financial assumptions side-by-side.
How It Works
- Step 1: Download the Excel file for Jangho Group Co., Ltd. (601886SS).
- Step 2: Review the pre-filled financial data and forecasts for Jangho Group Co., Ltd. (601886SS).
- Step 3: Adjust key inputs such as revenue growth, WACC, and tax rates (highlighted cells).
- Step 4: Observe the DCF model update in real-time as you modify your assumptions.
- Step 5: Evaluate the results and leverage them for your investment decisions regarding Jangho Group Co., Ltd. (601886SS).
Why Opt for Jangho Group's Calculator?
- Designed for Experts: A sophisticated tool utilized by finance professionals, analysts, and strategic consultants.
- Accurate Data: Jangho Group's (601886SS) historical and forecasted financial data preloaded for precision.
- What-If Analysis: Effortlessly simulate various scenarios and assumptions.
- Comprehensive Outputs: Automatically computes intrinsic value, NPV, and important financial metrics.
- User-Friendly: Clear, step-by-step instructions make the calculation process straightforward.
Who Should Utilize Jangho Group Co., Ltd. (601886SS)?
- Institutional Investors: Develop comprehensive and trustworthy valuation models for portfolio assessments.
- Corporate Finance Departments: Evaluate valuation scenarios to inform strategic decisions.
- Consultants and Financial Advisors: Offer clients precise valuation analyses for Jangho Group Co., Ltd. (601886SS).
- Students and Educators: Leverage real-world data to enhance financial modeling skills and education.
- Market Analysts: Gain insights into how companies like Jangho Group Co., Ltd. (601886SS) are valued within the industry.
Contents of the Template
- Operating and Balance Sheet Data: Pre-filled historical data and forecasts for Jangho Group Co., Ltd. (601886SS), covering revenue, EBITDA, EBIT, and capital expenditures.
- WACC Calculation: A dedicated sheet for calculating the Weighted Average Cost of Capital (WACC), including key parameters such as Beta, risk-free rate, and share price.
- DCF Valuation (Unlevered and Levered): Customizable Discounted Cash Flow models that detail intrinsic value calculations.
- Financial Statements: Pre-loaded annual and quarterly financial statements to facilitate in-depth analysis.
- Key Ratios: A comprehensive set of profitability, leverage, and efficiency ratios for Jangho Group Co., Ltd. (601886SS).
- Dashboard and Charts: Visual representations of valuation outcomes and assumptions for effective result analysis.
Disclaimer
All information, articles, and product details provided on this website are for general informational and educational purposes only. We do not claim any ownership over, nor do we intend to infringe upon, any trademarks, copyrights, logos, brand names, or other intellectual property mentioned or depicted on this site. Such intellectual property remains the property of its respective owners, and any references here are made solely for identification or informational purposes, without implying any affiliation, endorsement, or partnership.
We make no representations or warranties, express or implied, regarding the accuracy, completeness, or suitability of any content or products presented. Nothing on this website should be construed as legal, tax, investment, financial, medical, or other professional advice. In addition, no part of this site—including articles or product references—constitutes a solicitation, recommendation, endorsement, advertisement, or offer to buy or sell any securities, franchises, or other financial instruments, particularly in jurisdictions where such activity would be unlawful.
All content is of a general nature and may not address the specific circumstances of any individual or entity. It is not a substitute for professional advice or services. Any actions you take based on the information provided here are strictly at your own risk. You accept full responsibility for any decisions or outcomes arising from your use of this website and agree to release us from any liability in connection with your use of, or reliance upon, the content or products found herein.