
|
Jinduicheng Molybdän Co., Ltd. (601958.SS) DCF -Bewertung |
Fully Editable: Tailor To Your Needs In Excel Or Sheets
Professional Design: Trusted, Industry-Standard Templates
Investor-Approved Valuation Models
MAC/PC Compatible, Fully Unlocked
No Expertise Is Needed; Easy To Follow
Jinduicheng Molybdenum Co., Ltd. (601958.SS) Bundle
Optimieren Sie Ihre Analyse und verbessern Sie die Präzision mit unserem DCF -Taschenrechner (601958S)! Mit authentischen Jinduicheng Molybdän Co., Ltd. Daten und anpassbaren Annahmen ermöglichen dieses Tool Sie, Jinduicheng Molybdän wie ein erfahrener Investor zu prognostizieren, zu bewerten und zu bewerten.
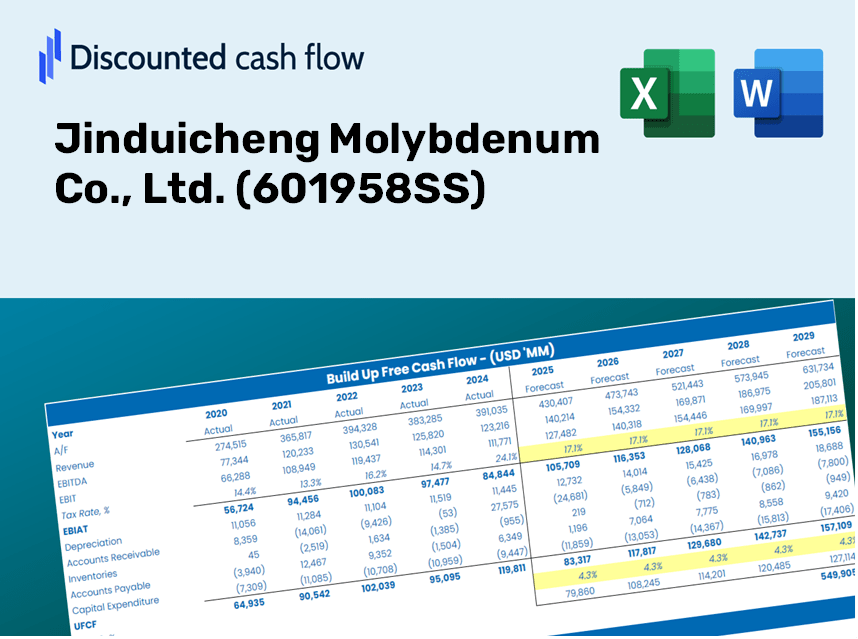
Discounted Cash Flow (DCF) - (USD MM)
| Year | AY1 2020 |
AY2 2021 |
AY3 2022 |
AY4 2023 |
AY5 2024 |
FY1 2025 |
FY2 2026 |
FY3 2027 |
FY4 2028 |
FY5 2029 |
|---|---|---|---|---|---|---|---|---|---|---|
| Revenue | 7,576.9 | 7,973.8 | 9,531.3 | 11,531.5 | 13,570.7 | 15,723.0 | 18,216.7 | 21,105.8 | 24,453.2 | 28,331.5 |
| Revenue Growth, % | 0 | 5.24 | 19.53 | 20.99 | 17.68 | 15.86 | 15.86 | 15.86 | 15.86 | 15.86 |
| EBITDA | 817.0 | 1,298.5 | 2,402.0 | 4,411.8 | 4,308.1 | 3,845.0 | 4,454.8 | 5,161.3 | 5,979.9 | 6,928.3 |
| EBITDA, % | 10.78 | 16.28 | 25.2 | 38.26 | 31.75 | 24.45 | 24.45 | 24.45 | 24.45 | 24.45 |
| Depreciation | 524.1 | 517.4 | 497.7 | 492.4 | 487.3 | 833.0 | 965.1 | 1,118.1 | 1,295.5 | 1,500.9 |
| Depreciation, % | 6.92 | 6.49 | 5.22 | 4.27 | 3.59 | 5.3 | 5.3 | 5.3 | 5.3 | 5.3 |
| EBIT | 292.9 | 781.1 | 1,904.3 | 3,919.4 | 3,820.7 | 3,012.0 | 3,489.7 | 4,043.2 | 4,684.5 | 5,427.4 |
| EBIT, % | 3.87 | 9.8 | 19.98 | 33.99 | 28.15 | 19.16 | 19.16 | 19.16 | 19.16 | 19.16 |
| Total Cash | 2,539.0 | 1,749.4 | 3,036.7 | 6,487.1 | 9,122.0 | 6,628.3 | 7,679.6 | 8,897.5 | 10,308.7 | 11,943.6 |
| Total Cash, percent | .0 | .0 | .0 | .0 | .0 | .0 | .0 | .0 | .0 | .0 |
| Account Receivables | 1,018.0 | 1,051.4 | 1,100.8 | 1,330.3 | 1,184.8 | 1,837.6 | 2,129.0 | 2,466.7 | 2,857.9 | 3,311.2 |
| Account Receivables, % | 13.43 | 13.19 | 11.55 | 11.54 | 8.73 | 11.69 | 11.69 | 11.69 | 11.69 | 11.69 |
| Inventories | 511.2 | 819.8 | 504.3 | 423.6 | 395.8 | 909.0 | 1,053.2 | 1,220.2 | 1,413.8 | 1,638.0 |
| Inventories, % | 6.75 | 10.28 | 5.29 | 3.67 | 2.92 | 5.78 | 5.78 | 5.78 | 5.78 | 5.78 |
| Accounts Payable | 647.6 | 759.7 | 809.9 | 840.6 | 759.5 | 1,240.8 | 1,437.6 | 1,665.6 | 1,929.8 | 2,235.8 |
| Accounts Payable, % | 8.55 | 9.53 | 8.5 | 7.29 | 5.6 | 7.89 | 7.89 | 7.89 | 7.89 | 7.89 |
| Capital Expenditure | -106.8 | -209.1 | -132.6 | -290.8 | -163.3 | -287.6 | -333.3 | -386.1 | -447.3 | -518.3 |
| Capital Expenditure, % | -1.41 | -2.62 | -1.39 | -2.52 | -1.2 | -1.83 | -1.83 | -1.83 | -1.83 | -1.83 |
| Tax Rate, % | 23.55 | 23.55 | 23.55 | 23.55 | 23.55 | 23.55 | 23.55 | 23.55 | 23.55 | 23.55 |
| EBITAT | 174.4 | 537.2 | 1,359.8 | 2,946.9 | 2,920.9 | 2,116.7 | 2,452.4 | 2,841.4 | 3,292.0 | 3,814.1 |
| Depreciation | ||||||||||
| Changes in Account Receivables | ||||||||||
| Changes in Inventories | ||||||||||
| Changes in Accounts Payable | ||||||||||
| Capital Expenditure | ||||||||||
| UFCF | -289.7 | 615.6 | 2,041.3 | 3,030.4 | 3,337.1 | 1,977.2 | 2,845.4 | 3,296.7 | 3,819.5 | 4,425.3 |
| WACC, % | 6.34 | 6.34 | 6.34 | 6.34 | 6.34 | 6.34 | 6.34 | 6.34 | 6.34 | 6.34 |
| PV UFCF | ||||||||||
| SUM PV UFCF | 13,357.5 | |||||||||
| Long Term Growth Rate, % | 3.50 | |||||||||
| Free cash flow (T + 1) | 4,580 | |||||||||
| Terminal Value | 161,162 | |||||||||
| Present Terminal Value | 118,505 | |||||||||
| Enterprise Value | 131,863 | |||||||||
| Net Debt | -5,633 | |||||||||
| Equity Value | 137,496 | |||||||||
| Diluted Shares Outstanding, MM | 3,242 | |||||||||
| Equity Value Per Share | 42.41 |
What You Will Receive
- Authentic Jinduicheng Molybdenum Financial Data: Pre-loaded with historical and projected figures for accurate analysis.
- Customizable Template: Easily adjust key parameters such as revenue growth, WACC, and EBITDA %.
- Instant Calculations: Watch the intrinsic value of Jinduicheng Molybdenum update in real-time as you make changes.
- Expert Valuation Tool: Crafted for investors, analysts, and consultants aiming for reliable DCF outcomes.
- Intuitive Layout: Clear organization and straightforward instructions suitable for all skill levels.
Key Features
- Comprehensive Jinduicheng Molybdenum Data: Pre-loaded with the company’s historical financial performance and forward-looking estimates.
- Customizable Parameters: Modify revenue growth rates, profit margins, WACC, taxation levels, and capital investments.
- Interactive Valuation Framework: Automatic recalculations of Net Present Value (NPV) and intrinsic value based on your specifications.
- Scenario Analysis: Develop multiple forecasting scenarios to explore various valuation possibilities.
- Intuitive User Experience: Designed to be straightforward and accessible for both experienced professionals and newcomers.
How It Functions
- 1. Access the Template: Download and open the Excel file containing Jinduicheng Molybdenum Co., Ltd.'s (601958SS) preloaded data.
- 2. Adjust Assumptions: Modify essential inputs such as growth rates, WACC, and capital expenditures.
- 3. View Results Instantly: The DCF model automatically calculates intrinsic value and NPV.
- 4. Explore Scenarios: Analyze various forecasts to evaluate different valuation outcomes.
- 5. Present with Confidence: Share professional valuation insights to enhance your decision-making.
Why Choose Jinduicheng Molybdenum Co., Ltd. (601958SS) Products?
- Time Efficiency: Skip the hassle of extensive research – our solutions are readily available for your needs.
- Enhanced Precision: We provide reliable data and methodologies to minimize discrepancies in your assessments.
- Fully Tailorable: Adjust our offerings to align with your specific requirements and forecasts.
- Simple to Understand: Our clear visuals and outputs ensure that the results are easily interpretable.
- Endorsed by Professionals: Developed for industry experts who prioritize accuracy and functionality.
Who Should Consider Jinduicheng Molybdenum Co., Ltd. ([601958SS])?
- Investors: Make informed investment choices with insights from a leading molybdenum producer.
- Financial Analysts: Streamline your research with access to detailed market data and analysis on [601958SS].
- Consultants: Utilize comprehensive reports to aid in client recommendations or strategic planning.
- Industry Enthusiasts: Enhance your knowledge of the molybdenum market through real-case scenarios and trends related to [601958SS].
- Educators and Students: Leverage this resource as a practical case study for finance and investment coursework.
Contents of the Template
- Operating and Balance Sheet Data: Pre-filled historical data and forecasts for Jinduicheng Molybdenum Co., Ltd. (601958SS), including metrics such as revenue, EBITDA, EBIT, and capital expenditures.
- WACC Calculation: A dedicated sheet for the Weighted Average Cost of Capital (WACC), featuring essential parameters like Beta, risk-free rate, and share price.
- DCF Valuation (Unlevered and Levered): Customizable Discounted Cash Flow models that present the intrinsic value along with comprehensive calculations.
- Financial Statements: Pre-loaded financial statements (annual and quarterly) to facilitate thorough analysis.
- Key Ratios: Includes critical profitability, leverage, and efficiency ratios relevant to Jinduicheng Molybdenum Co., Ltd. (601958SS).
- Dashboard and Charts: A visual summary of valuation outputs and assumptions to simplify result analysis.
Disclaimer
All information, articles, and product details provided on this website are for general informational and educational purposes only. We do not claim any ownership over, nor do we intend to infringe upon, any trademarks, copyrights, logos, brand names, or other intellectual property mentioned or depicted on this site. Such intellectual property remains the property of its respective owners, and any references here are made solely for identification or informational purposes, without implying any affiliation, endorsement, or partnership.
We make no representations or warranties, express or implied, regarding the accuracy, completeness, or suitability of any content or products presented. Nothing on this website should be construed as legal, tax, investment, financial, medical, or other professional advice. In addition, no part of this site—including articles or product references—constitutes a solicitation, recommendation, endorsement, advertisement, or offer to buy or sell any securities, franchises, or other financial instruments, particularly in jurisdictions where such activity would be unlawful.
All content is of a general nature and may not address the specific circumstances of any individual or entity. It is not a substitute for professional advice or services. Any actions you take based on the information provided here are strictly at your own risk. You accept full responsibility for any decisions or outcomes arising from your use of this website and agree to release us from any liability in connection with your use of, or reliance upon, the content or products found herein.