
|
China Automotive Engineering Research Institute Co., Ltd. (601965.Sss) DCF -Bewertung |
Fully Editable: Tailor To Your Needs In Excel Or Sheets
Professional Design: Trusted, Industry-Standard Templates
Investor-Approved Valuation Models
MAC/PC Compatible, Fully Unlocked
No Expertise Is Needed; Easy To Follow
China Automotive Engineering Research Institute Co., Ltd. (601965.SS) Bundle
Unser (601965S) DCF-Taschenrechner entwickelt für die Genauigkeit und ermöglicht es Ihnen, die Bewertung des China Automotive Engineering Research Institute Institute Co.
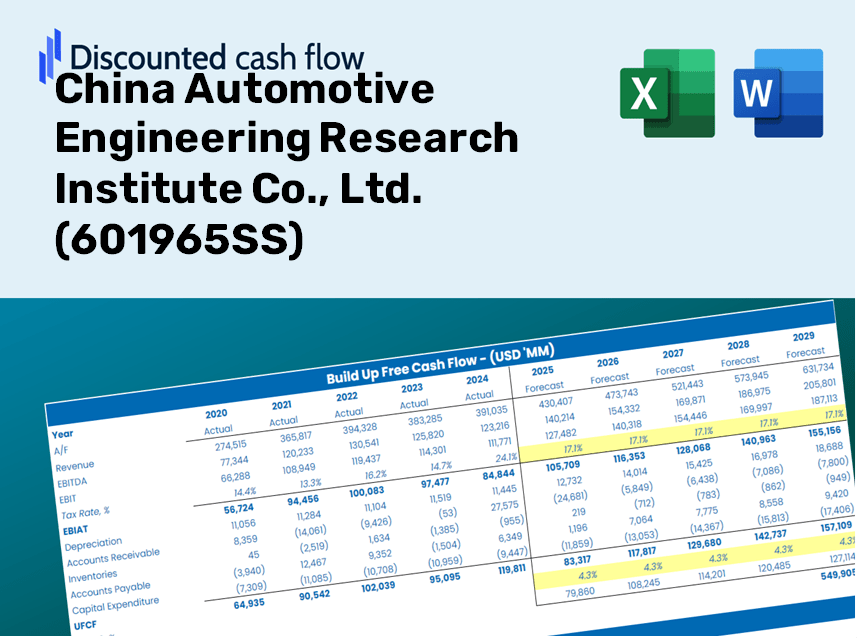
Discounted Cash Flow (DCF) - (USD MM)
| Year | AY1 2020 |
AY2 2021 |
AY3 2022 |
AY4 2023 |
AY5 2024 |
FY1 2025 |
FY2 2026 |
FY3 2027 |
FY4 2028 |
FY5 2029 |
|---|---|---|---|---|---|---|---|---|---|---|
| Revenue | 3,417.9 | 3,835.1 | 3,290.6 | 4,006.6 | 4,696.5 | 5,130.8 | 5,605.2 | 6,123.5 | 6,689.8 | 7,308.4 |
| Revenue Growth, % | 0 | 12.21 | -14.2 | 21.76 | 17.22 | 9.25 | 9.25 | 9.25 | 9.25 | 9.25 |
| EBITDA | 814.6 | 1,131.3 | 1,127.9 | 1,319.9 | 1,551.6 | 1,576.1 | 1,721.8 | 1,881.0 | 2,055.0 | 2,245.0 |
| EBITDA, % | 23.83 | 29.5 | 34.28 | 32.94 | 33.04 | 30.72 | 30.72 | 30.72 | 30.72 | 30.72 |
| Depreciation | 251.8 | 283.1 | 308.0 | 350.1 | 399.0 | 424.2 | 463.5 | 506.3 | 553.1 | 604.3 |
| Depreciation, % | 7.37 | 7.38 | 9.36 | 8.74 | 8.49 | 8.27 | 8.27 | 8.27 | 8.27 | 8.27 |
| EBIT | 562.8 | 848.3 | 819.9 | 969.8 | 1,152.6 | 1,151.8 | 1,258.4 | 1,374.7 | 1,501.8 | 1,640.7 |
| EBIT, % | 16.47 | 22.12 | 24.92 | 24.2 | 24.54 | 22.45 | 22.45 | 22.45 | 22.45 | 22.45 |
| Total Cash | 1,320.6 | 1,426.6 | 1,803.0 | 2,385.1 | 1,825.6 | 2,350.2 | 2,567.5 | 2,804.9 | 3,064.3 | 3,347.6 |
| Total Cash, percent | .0 | .0 | .0 | .0 | .0 | .0 | .0 | .0 | .0 | .0 |
| Account Receivables | 852.6 | 1,151.7 | 1,552.5 | 1,991.4 | 2,533.8 | 2,111.9 | 2,307.2 | 2,520.6 | 2,753.6 | 3,008.3 |
| Account Receivables, % | 24.95 | 30.03 | 47.18 | 49.7 | 53.95 | 41.16 | 41.16 | 41.16 | 41.16 | 41.16 |
| Inventories | 252.6 | 230.8 | 240.6 | 268.1 | 345.3 | 356.7 | 389.7 | 425.8 | 465.1 | 508.1 |
| Inventories, % | 7.39 | 6.02 | 7.31 | 6.69 | 7.35 | 6.95 | 6.95 | 6.95 | 6.95 | 6.95 |
| Accounts Payable | 526.2 | 538.9 | 154.3 | 890.2 | 1,239.0 | 849.0 | 927.5 | 1,013.2 | 1,106.9 | 1,209.3 |
| Accounts Payable, % | 15.4 | 14.05 | 4.69 | 22.22 | 26.38 | 16.55 | 16.55 | 16.55 | 16.55 | 16.55 |
| Capital Expenditure | -338.3 | -272.4 | -487.7 | -498.1 | -724.2 | -612.3 | -668.9 | -730.8 | -798.4 | -872.2 |
| Capital Expenditure, % | -9.9 | -7.1 | -14.82 | -12.43 | -15.42 | -11.93 | -11.93 | -11.93 | -11.93 | -11.93 |
| Tax Rate, % | 20.4 | 20.4 | 20.4 | 20.4 | 20.4 | 20.4 | 20.4 | 20.4 | 20.4 | 20.4 |
| EBITAT | 468.0 | 696.0 | 686.0 | 823.5 | 917.5 | 952.4 | 1,040.4 | 1,136.6 | 1,241.7 | 1,356.6 |
| Depreciation | ||||||||||
| Changes in Account Receivables | ||||||||||
| Changes in Inventories | ||||||||||
| Changes in Accounts Payable | ||||||||||
| Capital Expenditure | ||||||||||
| UFCF | -197.4 | 442.2 | -288.9 | 945.1 | 321.5 | 784.7 | 685.2 | 748.5 | 817.7 | 893.4 |
| WACC, % | 5.05 | 5.05 | 5.05 | 5.05 | 5.05 | 5.05 | 5.05 | 5.05 | 5.05 | 5.05 |
| PV UFCF | ||||||||||
| SUM PV UFCF | 3,383.2 | |||||||||
| Long Term Growth Rate, % | 3.00 | |||||||||
| Free cash flow (T + 1) | 920 | |||||||||
| Terminal Value | 44,869 | |||||||||
| Present Terminal Value | 35,071 | |||||||||
| Enterprise Value | 38,454 | |||||||||
| Net Debt | -1,599 | |||||||||
| Equity Value | 40,053 | |||||||||
| Diluted Shares Outstanding, MM | 987 | |||||||||
| Equity Value Per Share | 40.59 |
What You Will Receive
- Accurate CAERI Financial Data: Preloaded with historical and projected financial information for detailed analysis.
- Customizable Template: Easily adjust key inputs such as revenue growth, WACC, and EBITDA margin.
- Instant Calculations: Automatically update CAERI’s intrinsic value based on your input modifications.
- Advanced Valuation Tool: Tailored for investors, analysts, and consultants aiming for precise DCF assessments.
- Intuitive Interface: User-friendly layout and straightforward instructions for all skill levels.
Key Features
- Accurate Financial Data for China Automotive Engineering (601965SS): Access reliable historical data and future forecasts tailored for the automotive sector.
- Tailorable Projection Variables: Modify key inputs highlighted in yellow, such as WACC, growth rates, and profit margins.
- Automated Calculations: Real-time updates for DCF, Net Present Value (NPV), and cash flow assessments.
- User-Friendly Dashboard: Clear charts and summaries to easily interpret your valuation analysis.
- Designed for All Skill Levels: An intuitive layout suited for investors, CFOs, and industry consultants alike.
How It Functions
- Step 1: Download the Excel spreadsheet.
- Step 2: Examine the pre-loaded data for China Automotive Engineering Research Institute Co., Ltd. (601965SS) (historical and forecasted).
- Step 3: Modify key assumptions (highlighted in yellow) based on your insights.
- Step 4: Observe automatic updates reflecting the intrinsic value of China Automotive Engineering Research Institute Co., Ltd. (601965SS).
- Step 5: Utilize the results for making investment choices or reporting purposes.
Why Use This Calculator for China Automotive Engineering Research Institute (601965SS)?
- All-in-One Solution: Combines DCF, WACC, and financial ratio analyses for comprehensive insights.
- Flexible Inputs: Modify the yellow-highlighted fields to explore different scenarios.
- In-Depth Analysis: Automatically computes the intrinsic value and Net Present Value for China Automotive Engineering Research Institute.
- Preloaded Information: Access historical and projected data for reliable baseline assessments.
- High-Quality Standards: Perfect for financial analysts, investors, and consultants in the automotive sector.
Who Should Utilize This Service?
- Engineering Students: Explore automotive design principles and apply them using real-world examples.
- Researchers: Integrate industry-standard models into studies or academic projects.
- Investors: Evaluate your investment strategies and analyze valuation metrics for China Automotive Engineering Research Institute Co., Ltd. (601965SS).
- Analysts: Enhance your analysis process with a ready-to-use, adaptable financial model.
- Automotive Entrepreneurs: Understand the evaluation methods used for major automotive firms like China Automotive Engineering Research Institute Co., Ltd. (601965SS).
Contents of the Template
- Preloaded CAERI Data: Historical and forecasted financial data, encompassing revenue, EBIT, and capital expenditures.
- DCF and WACC Models: Comprehensive financial sheets for determining intrinsic value and Weighted Average Cost of Capital.
- Editable Inputs: Yellow-highlighted fields for modifying revenue growth, tax rates, and discount rates.
- Financial Statements: Detailed annual and quarterly financial reports for in-depth analysis.
- Key Ratios: Ratios for profitability, leverage, and efficiency to assess performance.
- Dashboard and Charts: Visual representations of valuation results and key assumptions.
Disclaimer
All information, articles, and product details provided on this website are for general informational and educational purposes only. We do not claim any ownership over, nor do we intend to infringe upon, any trademarks, copyrights, logos, brand names, or other intellectual property mentioned or depicted on this site. Such intellectual property remains the property of its respective owners, and any references here are made solely for identification or informational purposes, without implying any affiliation, endorsement, or partnership.
We make no representations or warranties, express or implied, regarding the accuracy, completeness, or suitability of any content or products presented. Nothing on this website should be construed as legal, tax, investment, financial, medical, or other professional advice. In addition, no part of this site—including articles or product references—constitutes a solicitation, recommendation, endorsement, advertisement, or offer to buy or sell any securities, franchises, or other financial instruments, particularly in jurisdictions where such activity would be unlawful.
All content is of a general nature and may not address the specific circumstances of any individual or entity. It is not a substitute for professional advice or services. Any actions you take based on the information provided here are strictly at your own risk. You accept full responsibility for any decisions or outcomes arising from your use of this website and agree to release us from any liability in connection with your use of, or reliance upon, the content or products found herein.