
|
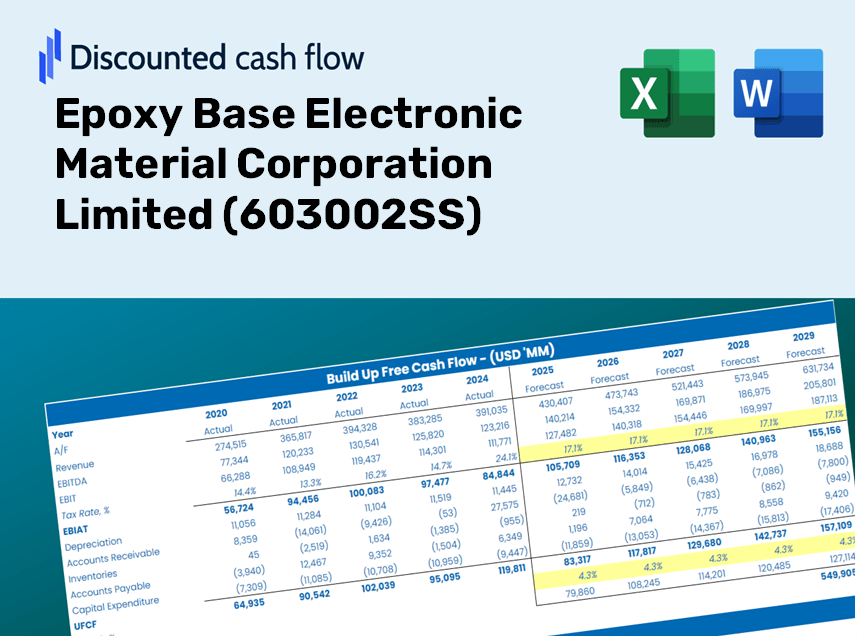
Epoxy Base Electronic Material Corporation Limited (603002.SS) DCF -Bewertung |
Fully Editable: Tailor To Your Needs In Excel Or Sheets
Professional Design: Trusted, Industry-Standard Templates
Investor-Approved Valuation Models
MAC/PC Compatible, Fully Unlocked
No Expertise Is Needed; Easy To Follow
Epoxy Base Electronic Material Corporation Limited (603002.SS) Bundle
Verbessern Sie Ihre Anlagestrategie mit dem DCF -Taschenrechner (603002S)! Erforschen Sie echte Finanzdaten von Epoxy Base Electronic Material Corporation Limited, passen Sie die Wachstumsvorhersagen und -kosten an und beobachten Sie sofort, wie sich diese Modifikationen auf den inneren Wert von (603002SS) auswirken.
Discounted Cash Flow (DCF) - (USD MM)
| Year | AY1 2020 |
AY2 2021 |
AY3 2022 |
AY4 2023 |
AY5 2024 |
FY1 2025 |
FY2 2026 |
FY3 2027 |
FY4 2028 |
FY5 2029 |
|---|---|---|---|---|---|---|---|---|---|---|
| Revenue | 2,504.2 | 4,452.7 | 3,022.4 | 2,240.4 | 2,144.4 | 2,227.6 | 2,314.1 | 2,403.9 | 2,497.3 | 2,594.2 |
| Revenue Growth, % | 0 | 77.81 | -32.12 | -25.87 | -4.29 | 3.88 | 3.88 | 3.88 | 3.88 | 3.88 |
| EBITDA | 287.8 | 487.8 | 191.4 | 123.6 | 73.8 | 168.1 | 174.7 | 181.4 | 188.5 | 195.8 |
| EBITDA, % | 11.49 | 10.96 | 6.33 | 5.51 | 3.44 | 7.55 | 7.55 | 7.55 | 7.55 | 7.55 |
| Depreciation | 37.7 | 53.9 | 53.8 | 54.8 | 53.0 | 41.9 | 43.6 | 45.3 | 47.0 | 48.8 |
| Depreciation, % | 1.51 | 1.21 | 1.78 | 2.45 | 2.47 | 1.88 | 1.88 | 1.88 | 1.88 | 1.88 |
| EBIT | 250.0 | 434.0 | 137.6 | 68.8 | 20.8 | 126.2 | 131.1 | 136.2 | 141.5 | 147.0 |
| EBIT, % | 9.98 | 9.75 | 4.55 | 3.07 | 0.97101 | 5.67 | 5.67 | 5.67 | 5.67 | 5.67 |
| Total Cash | 1,099.3 | 1,261.5 | 1,021.6 | 2,176.8 | 1,385.8 | 1,193.2 | 1,239.5 | 1,287.6 | 1,337.6 | 1,389.5 |
| Total Cash, percent | .0 | .0 | .0 | .0 | .0 | .0 | .0 | .0 | .0 | .0 |
| Account Receivables | 1,158.5 | 1,944.9 | 1,309.2 | 1,027.0 | 910.5 | 987.1 | 1,025.4 | 1,065.2 | 1,106.6 | 1,149.5 |
| Account Receivables, % | 46.26 | 43.68 | 43.32 | 45.84 | 42.46 | 44.31 | 44.31 | 44.31 | 44.31 | 44.31 |
| Inventories | 174.0 | 247.2 | 145.9 | 113.0 | 125.2 | 125.7 | 130.6 | 135.6 | 140.9 | 146.4 |
| Inventories, % | 6.95 | 5.55 | 4.83 | 5.04 | 5.84 | 5.64 | 5.64 | 5.64 | 5.64 | 5.64 |
| Accounts Payable | 1,003.2 | 1,638.2 | 796.7 | 743.6 | 649.9 | 742.7 | 771.6 | 801.5 | 832.6 | 865.0 |
| Accounts Payable, % | 40.06 | 36.79 | 26.36 | 33.19 | 30.31 | 33.34 | 33.34 | 33.34 | 33.34 | 33.34 |
| Capital Expenditure | -121.0 | -37.2 | -134.1 | -250.7 | -581.3 | -215.7 | -224.0 | -232.7 | -241.8 | -251.1 |
| Capital Expenditure, % | -4.83 | -0.83464 | -4.44 | -11.19 | -27.11 | -9.68 | -9.68 | -9.68 | -9.68 | -9.68 |
| Tax Rate, % | 13.08 | 13.08 | 13.08 | 13.08 | 13.08 | 13.08 | 13.08 | 13.08 | 13.08 | 13.08 |
| EBITAT | 217.5 | 372.8 | 117.9 | 62.4 | 18.1 | 110.1 | 114.4 | 118.8 | 123.4 | 128.2 |
| Depreciation | ||||||||||
| Changes in Account Receivables | ||||||||||
| Changes in Inventories | ||||||||||
| Changes in Accounts Payable | ||||||||||
| Capital Expenditure | ||||||||||
| UFCF | -195.2 | 164.8 | -66.9 | 128.7 | -499.6 | -47.9 | -80.4 | -83.6 | -86.8 | -90.2 |
| WACC, % | 6.37 | 6.37 | 6.37 | 6.37 | 6.37 | 6.37 | 6.37 | 6.37 | 6.37 | 6.37 |
| PV UFCF | ||||||||||
| SUM PV UFCF | -319.6 | |||||||||
| Long Term Growth Rate, % | 3.50 | |||||||||
| Free cash flow (T + 1) | -93 | |||||||||
| Terminal Value | -3,254 | |||||||||
| Present Terminal Value | -2,389 | |||||||||
| Enterprise Value | -2,709 | |||||||||
| Net Debt | -1,160 | |||||||||
| Equity Value | -1,549 | |||||||||
| Diluted Shares Outstanding, MM | 1,134 | |||||||||
| Equity Value Per Share | -1.37 |
What You Will Receive
- Authentic 603002SS Financial Data: Comprehensive historical and projected figures for precise valuation.
- Customizable Parameters: Adjust WACC, tax rates, revenue growth, and capital expenditures to fit your analysis.
- Automated Calculations: Intrinsic value and NPV are computed in real-time.
- Scenario Modeling: Explore various scenarios to assess the future performance of Epoxy Base Electronic Material Corporation Limited.
- User-Friendly Layout: Designed for professionals while remaining approachable for newcomers.
Key Features
- Comprehensive Historical Data: Pre-loaded with Epoxy Base Electronic Material Corporation Limited’s financial history and future projections.
- Customizable Parameters: Modify revenue growth rates, profit margins, discount rates, tax implications, and capital expenditures as needed.
- Interactive Valuation Tool: Automatic recalculations of Net Present Value (NPV) and intrinsic value in response to your adjustments.
- Scenario Analysis: Develop various forecasting scenarios to evaluate different potential valuation results.
- Intuitive Interface: Streamlined design catering to both experienced professionals and newcomers.
How It Functions
- Step 1: Download the Excel file.
- Step 2: Examine the pre-filled financial data and projections for Epoxy Base Electronic Material Corporation Limited (603002SS).
- Step 3: Adjust key inputs such as revenue growth, WACC, and tax rates (highlighted cells).
- Step 4: Observe the DCF model refresh in real-time as you alter assumptions.
- Step 5: Evaluate the outputs and leverage the findings for your investment strategies.
Why Opt for This Calculator?
- All-in-One Tool: Features DCF, WACC, and financial ratio analyses in a single solution.
- Adjustable Parameters: Modify the yellow-highlighted cells to explore different scenarios.
- In-Depth Analysis: Automatically computes the intrinsic value and Net Present Value for Epoxy Base Electronic Material Corporation Limited (603002SS).
- Preloaded Information: Access historical and projected data for reliable analysis.
- High-Quality Standards: Perfect for financial analysts, investors, and business consultants alike.
Who Can Benefit from This Product?
- Investors: Evaluate the valuation of Epoxy Base Electronic Material Corporation Limited (603002SS) before making investment decisions.
- CFOs and Financial Analysts: Simplify valuation methodologies and validate financial projections.
- Startup Founders: Understand the valuation processes of established companies like Epoxy Base Electronic Material Corporation Limited (603002SS).
- Consultants: Create comprehensive valuation reports for your clients based on industry benchmarks.
- Students and Educators: Utilize real data from Epoxy Base Electronic Material Corporation Limited (603002SS) to enhance practical learning in valuation techniques.
Overview of Template Features
- Pre-Filled DCF Model: Epoxy Base Electronic Material Corporation Limited’s (603002SS) financial data ready for immediate analysis.
- WACC Calculator: Comprehensive calculations for the Weighted Average Cost of Capital.
- Financial Ratios: Assess Epoxy Base’s profitability, leverage, and operational efficiency.
- Editable Inputs: Adjust parameters such as growth rates, margins, and CAPEX to suit your analysis needs.
- Financial Statements: Access annual and quarterly reports for in-depth evaluation.
- Interactive Dashboard: Effortlessly visualize key valuation metrics and outcomes.
Disclaimer
All information, articles, and product details provided on this website are for general informational and educational purposes only. We do not claim any ownership over, nor do we intend to infringe upon, any trademarks, copyrights, logos, brand names, or other intellectual property mentioned or depicted on this site. Such intellectual property remains the property of its respective owners, and any references here are made solely for identification or informational purposes, without implying any affiliation, endorsement, or partnership.
We make no representations or warranties, express or implied, regarding the accuracy, completeness, or suitability of any content or products presented. Nothing on this website should be construed as legal, tax, investment, financial, medical, or other professional advice. In addition, no part of this site—including articles or product references—constitutes a solicitation, recommendation, endorsement, advertisement, or offer to buy or sell any securities, franchises, or other financial instruments, particularly in jurisdictions where such activity would be unlawful.
All content is of a general nature and may not address the specific circumstances of any individual or entity. It is not a substitute for professional advice or services. Any actions you take based on the information provided here are strictly at your own risk. You accept full responsibility for any decisions or outcomes arising from your use of this website and agree to release us from any liability in connection with your use of, or reliance upon, the content or products found herein.