
|
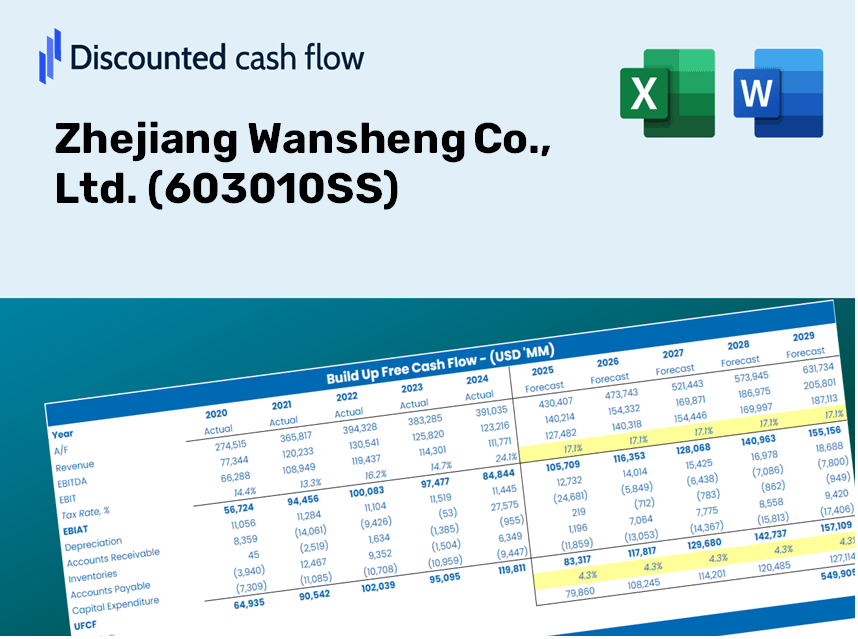
Zhejiang Wansheng Co., Ltd. (603010.SS) DCF -Bewertung |
Fully Editable: Tailor To Your Needs In Excel Or Sheets
Professional Design: Trusted, Industry-Standard Templates
Investor-Approved Valuation Models
MAC/PC Compatible, Fully Unlocked
No Expertise Is Needed; Easy To Follow
Zhejiang Wansheng Co., Ltd. (603010.SS) Bundle
Möchten Sie den inneren Wert von Zhejiang Wansheng Co., Ltd., bestimmen? Unser (603010SS) DCF-Taschenrechner integriert reale Daten mit umfangreichen Anpassungsoptionen, sodass Sie Prognosen anpassen und Ihre Anlageentscheidungen verbessern können.
What You Will Receive
- Authentic Zhejiang Wansheng Financial Data: Access historical and projected figures for precise analysis.
- Customizable Parameters: Adjust WACC, tax rates, growth projections, and capital expenditures as needed.
- Real-Time Calculations: Intrinsic value and NPV are computed automatically.
- Comprehensive Scenario Testing: Explore various scenarios to assess the future trajectory of Zhejiang Wansheng.
- User-Friendly and Professional Design: Tailored for industry experts while remaining approachable for newcomers.
Core Highlights
- Customizable Forecast Inputs: Adjust essential factors such as revenue growth, EBITDA margin, and capital expenses.
- Instant DCF Valuation: Quickly calculates intrinsic value, NPV, and related metrics.
- High-Precision Accuracy: Leverages Zhejiang Wansheng Co., Ltd.'s (603010SS) actual financial data for dependable valuation results.
- Effortless Scenario Analysis: Easily evaluate various assumptions and analyze outcomes side by side.
- Efficiency-Boosting Tool: Avoid the hassle of constructing intricate valuation models from the ground up.
How It Functions
- Download: Obtain the pre-configured Excel file containing Zhejiang Wansheng Co., Ltd.’s (603010SS) financial data.
- Customize: Modify projections such as revenue growth, EBITDA %, and WACC to suit your analysis.
- Update Automatically: The calculations for intrinsic value and NPV adjust in real-time.
- Test Scenarios: Develop various forecasts and evaluate results instantaneously.
- Make Decisions: Leverage the valuation findings to inform your investment strategy.
Why Opt for Zhejiang Wansheng Co., Ltd. (603010SS)?
- Precision: Access to authentic financial data guarantees high accuracy.
- Adaptability: Tailored for users to easily adjust and experiment with inputs.
- Efficiency: Eliminate the complexities of creating a financial model from the ground up.
- Expert-Quality: Crafted with the expertise and standards expected at the CFO level.
- Intuitive: Simple to navigate, even for individuals lacking extensive financial modeling expertise.
Who Can Benefit from Our Product?
- Finance Students: Master valuation methodologies and practice with actual market data for Zhejiang Wansheng Co., Ltd. (603010SS).
- Researchers: Utilize advanced models in your academic projects or studies related to Zhejiang Wansheng Co., Ltd. (603010SS).
- Investors: Validate your investment strategies and assess valuation results for Zhejiang Wansheng Co., Ltd. (603010SS).
- Market Analysts: Enhance your efficiency with a ready-to-use, customizable DCF model tailored for Zhejiang Wansheng Co., Ltd. (603010SS).
- Entrepreneurs: Discover how publicly listed firms like Zhejiang Wansheng Co., Ltd. (603010SS) are evaluated in the market.
Overview of the Template Components
- In-Depth DCF Model: Editable template featuring comprehensive valuation calculations.
- Actual Data: Zhejiang Wansheng Co., Ltd.’s (603010SS) historical and projected financials preloaded for thorough analysis.
- Adjustable Parameters: Tailor WACC, growth rates, and tax assumptions to evaluate various scenarios.
- Financial Statements: Complete annual and quarterly breakdowns for enhanced insights.
- Essential Ratios: Integrated analysis for profitability, efficiency, and financial leverage.
- Visual Dashboard: Charts and tables that present clear, actionable results.
Disclaimer
All information, articles, and product details provided on this website are for general informational and educational purposes only. We do not claim any ownership over, nor do we intend to infringe upon, any trademarks, copyrights, logos, brand names, or other intellectual property mentioned or depicted on this site. Such intellectual property remains the property of its respective owners, and any references here are made solely for identification or informational purposes, without implying any affiliation, endorsement, or partnership.
We make no representations or warranties, express or implied, regarding the accuracy, completeness, or suitability of any content or products presented. Nothing on this website should be construed as legal, tax, investment, financial, medical, or other professional advice. In addition, no part of this site—including articles or product references—constitutes a solicitation, recommendation, endorsement, advertisement, or offer to buy or sell any securities, franchises, or other financial instruments, particularly in jurisdictions where such activity would be unlawful.
All content is of a general nature and may not address the specific circumstances of any individual or entity. It is not a substitute for professional advice or services. Any actions you take based on the information provided here are strictly at your own risk. You accept full responsibility for any decisions or outcomes arising from your use of this website and agree to release us from any liability in connection with your use of, or reliance upon, the content or products found herein.