
|
CITIC Securities Company Limited (6030.HK) DCF -Bewertung |
Fully Editable: Tailor To Your Needs In Excel Or Sheets
Professional Design: Trusted, Industry-Standard Templates
Investor-Approved Valuation Models
MAC/PC Compatible, Fully Unlocked
No Expertise Is Needed; Easy To Follow
CITIC Securities Company Limited (6030.HK) Bundle
Erforschen Sie die finanziellen Aussichten von CITIC Securities Company Limited (6030 HK) mit unserem benutzerfreundlichen DCF-Taschenrechner! Geben Sie einfach Ihre Annahmen für Wachstum, Margen und Kosten für die Berechnung des inneren Werts von CITIC Securities Company Limited (6030 HK) ein und verbessern Sie Ihre Anlagestrategie.
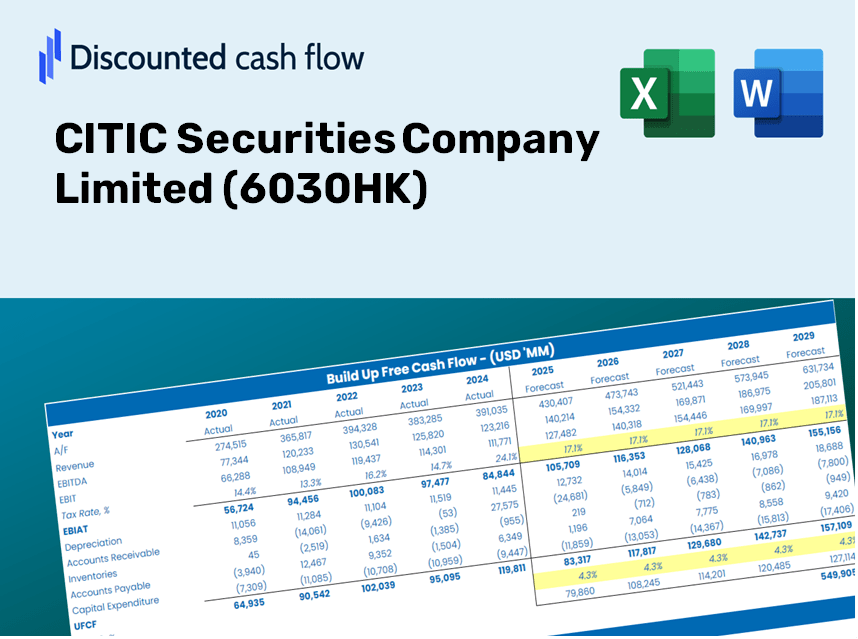
Discounted Cash Flow (DCF) - (USD MM)
| Year | AY1 2020 |
AY2 2021 |
AY3 2022 |
AY4 2023 |
AY5 2024 |
FY1 2025 |
FY2 2026 |
FY3 2027 |
FY4 2028 |
FY5 2029 |
|---|---|---|---|---|---|---|---|---|---|---|
| Revenue | 58,936.1 | 99,510.4 | 87,262.4 | 65,102.9 | 69,758.3 | 76,436.4 | 83,753.8 | 91,771.8 | 100,557.3 | 110,183.8 |
| Revenue Growth, % | 0 | 68.84 | -12.31 | -25.39 | 7.15 | 9.57 | 9.57 | 9.57 | 9.57 | 9.57 |
| EBITDA | .0 | .0 | 33,512.0 | .0 | .0 | 5,870.9 | 6,432.9 | 7,048.8 | 7,723.6 | 8,462.9 |
| EBITDA, % | 0 | 0 | 38.4 | 0 | 0 | 7.68 | 7.68 | 7.68 | 7.68 | 7.68 |
| Depreciation | 1,651.0 | 1,690.2 | 1,796.2 | 2,006.1 | 2,150.8 | 1,945.0 | 2,131.2 | 2,335.2 | 2,558.8 | 2,803.7 |
| Depreciation, % | 2.8 | 1.7 | 2.06 | 3.08 | 3.08 | 2.54 | 2.54 | 2.54 | 2.54 | 2.54 |
| EBIT | -1,651.0 | -1,690.2 | 31,715.8 | -2,006.1 | -2,150.8 | 3,925.9 | 4,301.7 | 4,713.6 | 5,164.8 | 5,659.2 |
| EBIT, % | -2.8 | -1.7 | 36.35 | -3.08 | -3.08 | 5.14 | 5.14 | 5.14 | 5.14 | 5.14 |
| Total Cash | 450,532.9 | 552,555.1 | 585,297.6 | 580,324.0 | 699,826.9 | 76,436.4 | 83,753.8 | 91,771.8 | 100,557.3 | 110,183.8 |
| Total Cash, percent | .0 | .0 | .0 | .0 | .0 | .0 | .0 | .0 | .0 | .0 |
| Account Receivables | 43,112.0 | 38,008.2 | 63,017.9 | 74,412.8 | 79,254.3 | 58,636.2 | 64,249.6 | 70,400.3 | 77,139.9 | 84,524.7 |
| Account Receivables, % | 73.15 | 38.2 | 72.22 | 114.3 | 113.61 | 76.71 | 76.71 | 76.71 | 76.71 | 76.71 |
| Inventories | .0 | .0 | .0 | .0 | .0 | .0 | .0 | .0 | .0 | .0 |
| Inventories, % | 0 | 0 | 0 | 0 | 0 | 0 | 0 | 0 | 0 | 0 |
| Accounts Payable | 130,310.6 | 192,708.9 | 224,897.9 | 216,982.2 | 217,115.3 | 76,436.4 | 83,753.8 | 91,771.8 | 100,557.3 | 110,183.8 |
| Accounts Payable, % | 221.1 | 193.66 | 257.73 | 333.29 | 311.24 | 100 | 100 | 100 | 100 | 100 |
| Capital Expenditure | -667.5 | -788.5 | -1,428.6 | -1,730.7 | -1,416.9 | -1,261.4 | -1,382.2 | -1,514.5 | -1,659.5 | -1,818.4 |
| Capital Expenditure, % | -1.13 | -0.79237 | -1.64 | -2.66 | -2.03 | -1.65 | -1.65 | -1.65 | -1.65 | -1.65 |
| Tax Rate, % | 23.63 | 23.63 | 23.63 | 23.63 | 23.63 | 23.63 | 23.63 | 23.63 | 23.63 | 23.63 |
| EBITAT | -1,201.9 | -1,224.2 | 23,353.9 | -1,510.8 | -1,642.6 | 2,909.4 | 3,188.0 | 3,493.2 | 3,827.6 | 4,194.0 |
| Depreciation | ||||||||||
| Changes in Account Receivables | ||||||||||
| Changes in Inventories | ||||||||||
| Changes in Accounts Payable | ||||||||||
| Capital Expenditure | ||||||||||
| UFCF | 86,980.3 | 67,179.6 | 30,900.7 | -20,546.1 | -5,617.0 | -116,467.9 | 5,641.0 | 6,181.0 | 6,772.7 | 7,421.1 |
| WACC, % | 7.53 | 7.51 | 7.55 | 7.61 | 7.64 | 7.57 | 7.57 | 7.57 | 7.57 | 7.57 |
| PV UFCF | ||||||||||
| SUM PV UFCF | -88,220.5 | |||||||||
| Long Term Growth Rate, % | 2.00 | |||||||||
| Free cash flow (T + 1) | 7,570 | |||||||||
| Terminal Value | 135,913 | |||||||||
| Present Terminal Value | 94,366 | |||||||||
| Enterprise Value | 6,146 | |||||||||
| Net Debt | -493,488 | |||||||||
| Equity Value | 499,634 | |||||||||
| Diluted Shares Outstanding, MM | 14,821 | |||||||||
| Equity Value Per Share | 33.71 |
What You Will Receive
- Comprehensive CITIC Financials: Access to historical and projected data for precise valuation.
- Customizable Inputs: Adjust WACC, tax rates, revenue growth, and capital expenditures as needed.
- Real-Time Calculations: Intrinsic value and NPV are calculated automatically.
- Scenario Analysis: Evaluate various scenarios to assess the future performance of CITIC Securities (6030HK).
- User-Friendly Design: Designed for professionals, yet easy for newcomers to navigate.
Key Features
- Comprehensive Historical Data: CITIC Securities Company Limited’s historical financial statements and pre-filled projections.
- Fully Customizable Inputs: Adjust WACC, tax rates, revenue growth, and EBITDA margins as needed.
- Real-Time Calculations: Instantly view the intrinsic value of CITIC Securities Company Limited, recalculating dynamically.
- Intuitive Visual Outputs: Dashboard charts illustrate valuation results and essential metrics clearly.
- Designed for Precision: A professional-grade tool tailored for analysts, investors, and finance professionals.
How It Works
- Download the Template: Gain immediate access to the Excel-based CITIC Securities DCF Calculator.
- Input Your Assumptions: Modify the yellow-highlighted cells for growth rates, WACC, margins, and other parameters.
- Instant Calculations: The model automatically calculates the intrinsic value of CITIC Securities Company Limited (6030HK).
- Test Scenarios: Experiment with various assumptions to assess potential changes in valuation.
- Analyze and Decide: Utilize the results to inform your investment or financial decision-making.
Why Opt for This Calculator for CITIC Securities Company Limited (6030HK)?
- Precise Data: Accurate financial information from CITIC Securities ensures trustworthy valuation outcomes.
- Customizable Options: Tailor essential parameters like growth rates, WACC, and tax rates to align with your forecasts.
- Efficient: With pre-configured calculations, you won’t have to start from the ground up.
- Professional-Grade Resource: Ideal for investors, analysts, and consultants in the financial sector.
- User-Friendly Interface: An intuitive design and guide make it accessible for all users.
Who Should Utilize This Product?
- Individual Investors: Make well-informed choices regarding the purchase or sale of CITIC Securities Company Limited (6030HK) shares.
- Financial Analysts: Enhance your valuation methodologies with accessible financial models.
- Consultants: Provide clients with precise and expedited valuation insights.
- Business Owners: Gain insights into the valuation of major firms like CITIC Securities Company Limited (6030HK) to inform your own business strategies.
- Finance Students: Acquire knowledge of valuation techniques through practical data and case studies.
Contents of the Template
- Historical Data: Contains CITIC Securities' past financials and foundational forecasts.
- DCF and Levered DCF Models: Comprehensive templates for calculating CITIC Securities' intrinsic value.
- WACC Sheet: Pre-configured calculations for the Weighted Average Cost of Capital.
- Editable Inputs: Customize essential drivers such as growth rates, EBITDA percentages, and CAPEX assumptions.
- Quarterly and Annual Statements: Detailed analysis of CITIC Securities' financial performance.
- Interactive Dashboard: Dynamically visualize valuation results and forecasts.
Disclaimer
All information, articles, and product details provided on this website are for general informational and educational purposes only. We do not claim any ownership over, nor do we intend to infringe upon, any trademarks, copyrights, logos, brand names, or other intellectual property mentioned or depicted on this site. Such intellectual property remains the property of its respective owners, and any references here are made solely for identification or informational purposes, without implying any affiliation, endorsement, or partnership.
We make no representations or warranties, express or implied, regarding the accuracy, completeness, or suitability of any content or products presented. Nothing on this website should be construed as legal, tax, investment, financial, medical, or other professional advice. In addition, no part of this site—including articles or product references—constitutes a solicitation, recommendation, endorsement, advertisement, or offer to buy or sell any securities, franchises, or other financial instruments, particularly in jurisdictions where such activity would be unlawful.
All content is of a general nature and may not address the specific circumstances of any individual or entity. It is not a substitute for professional advice or services. Any actions you take based on the information provided here are strictly at your own risk. You accept full responsibility for any decisions or outcomes arising from your use of this website and agree to release us from any liability in connection with your use of, or reliance upon, the content or products found herein.