
|
Shanghai Hugong Electric Group Co., Ltd. (603131.SS) DCF -Bewertung |
Fully Editable: Tailor To Your Needs In Excel Or Sheets
Professional Design: Trusted, Industry-Standard Templates
Investor-Approved Valuation Models
MAC/PC Compatible, Fully Unlocked
No Expertise Is Needed; Easy To Follow
Shanghai Hugong Electric Group Co.,Ltd. (603131.SS) Bundle
Als Anleger oder Analyst ist der DCF -Taschenrechner von [603131S] für eine genaue Bewertung unerlässlich. Mit echten Daten von Shanghai Hugong Electric Group Co., Ltd., können Sie die Prognosen anpassen und die Auswirkungen sofort beobachten.
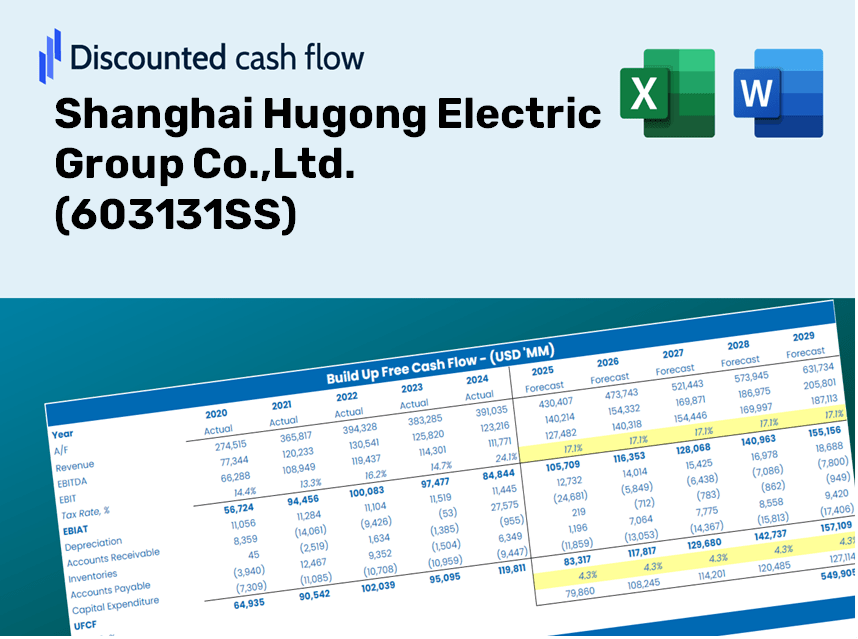
Discounted Cash Flow (DCF) - (USD MM)
| Year | AY1 2020 |
AY2 2021 |
AY3 2022 |
AY4 2023 |
AY5 2024 |
FY1 2025 |
FY2 2026 |
FY3 2027 |
FY4 2028 |
FY5 2029 |
|---|---|---|---|---|---|---|---|---|---|---|
| Revenue | 1,085.8 | 1,311.4 | 991.5 | 1,053.0 | 1,079.2 | 1,092.8 | 1,106.7 | 1,120.7 | 1,134.9 | 1,149.3 |
| Revenue Growth, % | 0 | 20.78 | -24.4 | 6.2 | 2.49 | 1.27 | 1.27 | 1.27 | 1.27 | 1.27 |
| EBITDA | 176.3 | 227.6 | -57.5 | 11.9 | 79.2 | 79.2 | 80.2 | 81.3 | 82.3 | 83.3 |
| EBITDA, % | 16.23 | 17.35 | -5.8 | 1.13 | 7.34 | 7.25 | 7.25 | 7.25 | 7.25 | 7.25 |
| Depreciation | 30.5 | 43.2 | 47.8 | 43.4 | 40.4 | 41.1 | 41.6 | 42.1 | 42.7 | 43.2 |
| Depreciation, % | 2.81 | 3.29 | 4.83 | 4.12 | 3.75 | 3.76 | 3.76 | 3.76 | 3.76 | 3.76 |
| EBIT | 145.8 | 184.4 | -105.4 | -31.5 | 38.8 | 38.2 | 38.7 | 39.1 | 39.6 | 40.1 |
| EBIT, % | 13.42 | 14.06 | -10.63 | -2.99 | 3.6 | 3.49 | 3.49 | 3.49 | 3.49 | 3.49 |
| Total Cash | 747.4 | 662.8 | 871.7 | 869.6 | 1,104.5 | 852.2 | 863.0 | 873.9 | 885.0 | 896.2 |
| Total Cash, percent | .0 | .0 | .0 | .0 | .0 | .0 | .0 | .0 | .0 | .0 |
| Account Receivables | 361.0 | 491.0 | 465.4 | 450.5 | 360.9 | 423.7 | 429.1 | 434.5 | 440.0 | 445.6 |
| Account Receivables, % | 33.24 | 37.44 | 46.94 | 42.78 | 33.45 | 38.77 | 38.77 | 38.77 | 38.77 | 38.77 |
| Inventories | 294.9 | 346.2 | 340.4 | 336.0 | 282.2 | 319.0 | 323.0 | 327.1 | 331.3 | 335.5 |
| Inventories, % | 27.16 | 26.4 | 34.33 | 31.91 | 26.15 | 29.19 | 29.19 | 29.19 | 29.19 | 29.19 |
| Accounts Payable | 340.2 | 353.0 | 325.0 | 328.9 | 353.5 | 338.8 | 343.1 | 347.5 | 351.9 | 356.3 |
| Accounts Payable, % | 31.33 | 26.92 | 32.78 | 31.24 | 32.75 | 31 | 31 | 31 | 31 | 31 |
| Capital Expenditure | -60.5 | -44.9 | -13.4 | -5.3 | -12.4 | -26.2 | -26.6 | -26.9 | -27.3 | -27.6 |
| Capital Expenditure, % | -5.58 | -3.42 | -1.36 | -0.50673 | -1.15 | -2.4 | -2.4 | -2.4 | -2.4 | -2.4 |
| Tax Rate, % | 30.5 | 30.5 | 30.5 | 30.5 | 30.5 | 30.5 | 30.5 | 30.5 | 30.5 | 30.5 |
| EBITAT | 128.0 | 163.7 | -117.1 | -31.7 | 27.0 | 34.1 | 34.5 | 34.9 | 35.4 | 35.8 |
| Depreciation | ||||||||||
| Changes in Account Receivables | ||||||||||
| Changes in Inventories | ||||||||||
| Changes in Accounts Payable | ||||||||||
| Capital Expenditure | ||||||||||
| UFCF | -217.7 | -6.5 | -79.4 | 29.7 | 222.8 | -65.3 | 44.4 | 44.9 | 45.5 | 46.1 |
| WACC, % | 6.16 | 6.16 | 6.19 | 6.19 | 6.1 | 6.16 | 6.16 | 6.16 | 6.16 | 6.16 |
| PV UFCF | ||||||||||
| SUM PV UFCF | 85.4 | |||||||||
| Long Term Growth Rate, % | 2.00 | |||||||||
| Free cash flow (T + 1) | 47 | |||||||||
| Terminal Value | 1,130 | |||||||||
| Present Terminal Value | 838 | |||||||||
| Enterprise Value | 923 | |||||||||
| Net Debt | -55 | |||||||||
| Equity Value | 978 | |||||||||
| Diluted Shares Outstanding, MM | 314 | |||||||||
| Equity Value Per Share | 3.12 |
What You Will Receive
- Fully Customizable Excel Template: An adaptable Excel-based DCF Calculator featuring pre-filled, real financial data for Shanghai Hugong Electric Group Co., Ltd. (603131SS).
- Comprehensive Data: Access to historical data along with forward-looking projections (highlighted in the yellow cells).
- Adaptable Forecasting: Modify forecast parameters such as revenue growth, EBITDA percentage, and WACC easily.
- Instant Calculations: Instantly observe how your inputs influence the valuation of Shanghai Hugong Electric Group Co., Ltd. (603131SS).
- Professional Quality Tool: Designed for use by investors, CFOs, consultants, and financial analysts.
- Intuitive Layout: Organized for user-friendliness, complete with step-by-step guidance.
Key Features
- Comprehensive DCF Calculator: Offers detailed unlevered and levered DCF valuation models specifically tailored for Shanghai Hugong Electric Group Co., Ltd. (603131SS).
- WACC Calculator: Comes with a pre-structured Weighted Average Cost of Capital sheet featuring adjustable inputs.
- Customizable Forecast Assumptions: Adjust growth rates, capital expenditures, and discount rates as needed.
- Integrated Financial Ratios: Assess profitability, leverage, and efficiency ratios relevant to Shanghai Hugong Electric Group Co., Ltd. (603131SS).
- Visual Dashboard and Charts: Provides graphical outputs that summarize essential valuation metrics for streamlined analysis.
How It Functions
- 1. Access the Template: Download and open the Excel file containing Shanghai Hugong Electric Group Co., Ltd.'s preloaded data.
- 2. Modify Assumptions: Adjust key parameters such as growth rates, WACC, and capital expenditures.
- 3. View Results in Real-Time: The DCF model automatically calculates intrinsic value and NPV.
- 4. Explore Scenarios: Analyze various forecasts to evaluate different valuation results.
- 5. Present with Assurance: Provide professional valuation insights to justify your decisions.
Why Opt for This Calculator?
- User-Friendly Interface: Tailored for both novices and seasoned users.
- Customizable Inputs: Modify parameters easily to suit your analysis needs.
- Real-Time Adjustments: Observe immediate changes to Shanghai Hugong Electric's valuation as you tweak the inputs.
- Pre-Loaded Data: Comes equipped with Shanghai Hugong Electric's actual financial figures for swift evaluations.
- Relied Upon by Experts: Trusted by investors and analysts for making well-informed choices.
Who Should Benefit from This Product?
- Institutional Investors: Develop comprehensive and accurate valuation models for assessing investment opportunities in Shanghai Hugong Electric Group Co.,Ltd. (603131SS).
- Corporate Finance Departments: Evaluate various valuation scenarios to inform strategic decisions within the organization.
- Financial Consultants and Advisors: Deliver precise valuation insights to clients interested in the performance of Shanghai Hugong Electric Group Co.,Ltd. (603131SS).
- Students and Educators: Utilize real market data to enhance learning and practice in financial modeling.
- Industry Analysts: Gain insights into how companies like Shanghai Hugong Electric Group Co.,Ltd. (603131SS) are valued within the electric manufacturing sector.
What the Template Contains
- Historical Data: Includes Shanghai Hugong Electric Group Co., Ltd.’s past financials and baseline forecasts.
- DCF and Levered DCF Models: Comprehensive templates for calculating the intrinsic value of Shanghai Hugong Electric Group Co., Ltd. (603131SS).
- WACC Sheet: Pre-configured calculations for Weighted Average Cost of Capital.
- Editable Inputs: Adjust key factors such as growth rates, EBITDA %, and CAPEX assumptions.
- Quarterly and Annual Statements: A thorough analysis of Shanghai Hugong Electric Group Co., Ltd.’s financials.
- Interactive Dashboard: Dynamically visualize valuation results and projections.
Disclaimer
All information, articles, and product details provided on this website are for general informational and educational purposes only. We do not claim any ownership over, nor do we intend to infringe upon, any trademarks, copyrights, logos, brand names, or other intellectual property mentioned or depicted on this site. Such intellectual property remains the property of its respective owners, and any references here are made solely for identification or informational purposes, without implying any affiliation, endorsement, or partnership.
We make no representations or warranties, express or implied, regarding the accuracy, completeness, or suitability of any content or products presented. Nothing on this website should be construed as legal, tax, investment, financial, medical, or other professional advice. In addition, no part of this site—including articles or product references—constitutes a solicitation, recommendation, endorsement, advertisement, or offer to buy or sell any securities, franchises, or other financial instruments, particularly in jurisdictions where such activity would be unlawful.
All content is of a general nature and may not address the specific circumstances of any individual or entity. It is not a substitute for professional advice or services. Any actions you take based on the information provided here are strictly at your own risk. You accept full responsibility for any decisions or outcomes arising from your use of this website and agree to release us from any liability in connection with your use of, or reliance upon, the content or products found herein.