
|
Cybrid Technologies Inc. (603212.SS) DCF -Bewertung |
Fully Editable: Tailor To Your Needs In Excel Or Sheets
Professional Design: Trusted, Industry-Standard Templates
Investor-Approved Valuation Models
MAC/PC Compatible, Fully Unlocked
No Expertise Is Needed; Easy To Follow
Cybrid Technologies Inc. (603212.SS) Bundle
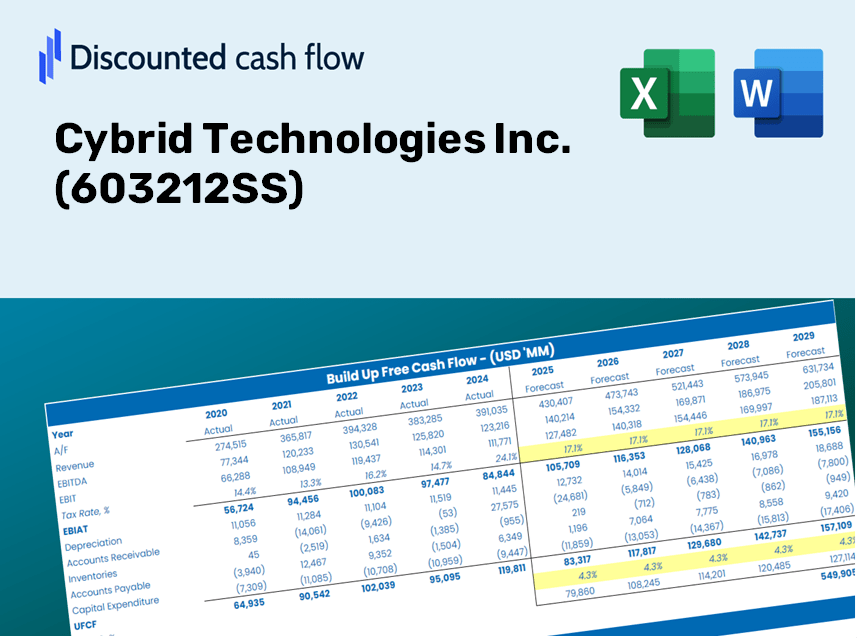
Vereinfachen Sie Cybrid Technologies Inc. (603212SS) Bewertung mit diesem anpassbaren DCF -Taschenrechner! Mit Real Cybrid Technologies Inc. (603212S) Finanzdaten und einstellbaren Prognoseeingängen können Sie Szenarien testen und Cybrid Technologies Inc. (603212SS) in Minuten fairen Wert aufdecken.
Discounted Cash Flow (DCF) - (USD MM)
| Year | AY1 2020 |
AY2 2021 |
AY3 2022 |
AY4 2023 |
AY5 2024 |
FY1 2025 |
FY2 2026 |
FY3 2027 |
FY4 2028 |
FY5 2029 |
|---|---|---|---|---|---|---|---|---|---|---|
| Revenue | 2,182.5 | 3,017.3 | 4,115.3 | 4,165.6 | 3,004.0 | 3,364.3 | 3,767.8 | 4,219.7 | 4,725.8 | 5,292.7 |
| Revenue Growth, % | 0 | 38.25 | 36.39 | 1.22 | -27.89 | 11.99 | 11.99 | 11.99 | 11.99 | 11.99 |
| EBITDA | 273.7 | 286.8 | 318.6 | 225.5 | -167.2 | 199.4 | 223.3 | 250.1 | 280.1 | 313.7 |
| EBITDA, % | 12.54 | 9.51 | 7.74 | 5.41 | -5.57 | 5.93 | 5.93 | 5.93 | 5.93 | 5.93 |
| Depreciation | 34.5 | 62.1 | 82.3 | 93.7 | 110.3 | 77.8 | 87.1 | 97.6 | 109.3 | 122.4 |
| Depreciation, % | 1.58 | 2.06 | 2 | 2.25 | 3.67 | 2.31 | 2.31 | 2.31 | 2.31 | 2.31 |
| EBIT | 239.2 | 224.7 | 236.3 | 131.8 | -277.5 | 121.6 | 136.2 | 152.5 | 170.8 | 191.3 |
| EBIT, % | 10.96 | 7.45 | 5.74 | 3.16 | -9.24 | 3.62 | 3.62 | 3.62 | 3.62 | 3.62 |
| Total Cash | 580.4 | 1,284.3 | 1,046.3 | 778.4 | 606.3 | 898.0 | 1,005.7 | 1,126.3 | 1,261.4 | 1,412.6 |
| Total Cash, percent | .0 | .0 | .0 | .0 | .0 | .0 | .0 | .0 | .0 | .0 |
| Account Receivables | 1,420.5 | 1,657.2 | 1,837.0 | 2,048.7 | 1,745.9 | 1,829.9 | 2,049.3 | 2,295.1 | 2,570.4 | 2,878.7 |
| Account Receivables, % | 65.09 | 54.92 | 44.64 | 49.18 | 58.12 | 54.39 | 54.39 | 54.39 | 54.39 | 54.39 |
| Inventories | 354.4 | 616.4 | 677.7 | 699.1 | 488.8 | 579.9 | 649.5 | 727.4 | 814.6 | 912.3 |
| Inventories, % | 16.24 | 20.43 | 16.47 | 16.78 | 16.27 | 17.24 | 17.24 | 17.24 | 17.24 | 17.24 |
| Accounts Payable | 787.9 | 913.4 | 697.7 | 629.7 | 629.2 | 803.3 | 899.7 | 1,007.6 | 1,128.4 | 1,263.8 |
| Accounts Payable, % | 36.1 | 30.27 | 16.95 | 15.12 | 20.94 | 23.88 | 23.88 | 23.88 | 23.88 | 23.88 |
| Capital Expenditure | -518.7 | -269.8 | -220.0 | -155.8 | -159.1 | -316.8 | -354.8 | -397.4 | -445.0 | -498.4 |
| Capital Expenditure, % | -23.76 | -8.94 | -5.35 | -3.74 | -5.29 | -9.42 | -9.42 | -9.42 | -9.42 | -9.42 |
| Tax Rate, % | 9.53 | 9.53 | 9.53 | 9.53 | 9.53 | 9.53 | 9.53 | 9.53 | 9.53 | 9.53 |
| EBITAT | 209.0 | 198.6 | 224.3 | 168.9 | -251.0 | 112.2 | 125.6 | 140.7 | 157.6 | 176.5 |
| Depreciation | ||||||||||
| Changes in Account Receivables | ||||||||||
| Changes in Inventories | ||||||||||
| Changes in Accounts Payable | ||||||||||
| Capital Expenditure | ||||||||||
| UFCF | -1,262.2 | -382.2 | -370.2 | -194.3 | 212.7 | -127.7 | -334.8 | -374.9 | -419.9 | -470.2 |
| WACC, % | 9.23 | 9.24 | 9.28 | 9.32 | 9.25 | 9.26 | 9.26 | 9.26 | 9.26 | 9.26 |
| PV UFCF | ||||||||||
| SUM PV UFCF | -1,281.3 | |||||||||
| Long Term Growth Rate, % | 3.50 | |||||||||
| Free cash flow (T + 1) | -487 | |||||||||
| Terminal Value | -8,445 | |||||||||
| Present Terminal Value | -5,423 | |||||||||
| Enterprise Value | -6,704 | |||||||||
| Net Debt | 136 | |||||||||
| Equity Value | -6,840 | |||||||||
| Diluted Shares Outstanding, MM | 438 | |||||||||
| Equity Value Per Share | -15.60 |
What You Will Receive
- Pre-Filled Financial Model: Utilizes Cybrid Technologies Inc.'s (603212SS) actual data for accurate DCF valuation.
- Comprehensive Forecast Control: Modify revenue growth, margins, WACC, and other essential drivers.
- Real-Time Calculations: Instant updates allow you to view results immediately as changes are made.
- Professional-Grade Template: A polished Excel file crafted for high-quality valuation presentations.
- Adaptable and Reusable: Designed for flexibility, enabling multiple uses for in-depth forecasting.
Key Features
- 🔍 Real-Life CYBR Financials: Pre-filled historical and projected data for Cybrid Technologies Inc. (603212SS).
- ✏️ Fully Customizable Inputs: Adjust all key parameters (yellow cells) such as WACC, growth %, and tax rates.
- 📊 Professional DCF Valuation: Integrated formulas determine Cybrid's intrinsic value using the Discounted Cash Flow method.
- ⚡ Instant Results: Visualize Cybrid's valuation immediately after making adjustments.
- Scenario Analysis: Evaluate and compare results for different financial assumptions side-by-side.
How It Operates
- Download: Obtain the pre-formatted Excel file featuring Cybrid Technologies Inc. (603212SS) financial data.
- Customize: Modify projections such as revenue growth, EBITDA %, and WACC as needed.
- Update Automatically: Watch as the intrinsic value and NPV calculations refresh in real-time.
- Test Scenarios: Develop various projections and instantly compare results.
- Make Decisions: Leverage the valuation outcomes to inform your investment approach.
Why Opt for Cybrid Technologies Inc. (603212SS) Calculator?
- Precision: Utilizes authentic Cybrid financial data for reliable results.
- Adaptability: Allows users to freely experiment and adjust input parameters.
- Efficiency: Eliminate the need to construct a financial model from the ground up.
- Expert-Quality: Crafted with the accuracy and usability expected at the CFO level.
- Intuitive: Simple to navigate, suitable for users with minimal financial modeling skills.
Who Can Benefit from This Product?
- Investors: Accurately assess the fair value of Cybrid Technologies Inc. (603212SS) prior to making investment choices.
- CFOs: Utilize a top-tier DCF model for comprehensive financial reporting and analysis.
- Consultants: Efficiently customize the template for client valuation reports.
- Entrepreneurs: Acquire valuable insights into the financial modeling practices of leading companies.
- Educators: Employ this tool as a resource for teaching valuation techniques.
Contents of the Template
- Pre-Filled DCF Model: Cybrid Technologies Inc.'s financial data preloaded for immediate application.
- WACC Calculator: Comprehensive calculations for the Weighted Average Cost of Capital.
- Financial Ratios: Analyze Cybrid Technologies Inc.'s profitability, leverage, and operational efficiency.
- Editable Inputs: Modify assumptions such as growth rates, profit margins, and capital expenditures to tailor to your scenarios.
- Financial Statements: Access annual and quarterly reports to facilitate in-depth analysis.
- Interactive Dashboard: Effortlessly visualize essential valuation metrics and outcomes.
Disclaimer
All information, articles, and product details provided on this website are for general informational and educational purposes only. We do not claim any ownership over, nor do we intend to infringe upon, any trademarks, copyrights, logos, brand names, or other intellectual property mentioned or depicted on this site. Such intellectual property remains the property of its respective owners, and any references here are made solely for identification or informational purposes, without implying any affiliation, endorsement, or partnership.
We make no representations or warranties, express or implied, regarding the accuracy, completeness, or suitability of any content or products presented. Nothing on this website should be construed as legal, tax, investment, financial, medical, or other professional advice. In addition, no part of this site—including articles or product references—constitutes a solicitation, recommendation, endorsement, advertisement, or offer to buy or sell any securities, franchises, or other financial instruments, particularly in jurisdictions where such activity would be unlawful.
All content is of a general nature and may not address the specific circumstances of any individual or entity. It is not a substitute for professional advice or services. Any actions you take based on the information provided here are strictly at your own risk. You accept full responsibility for any decisions or outcomes arising from your use of this website and agree to release us from any liability in connection with your use of, or reliance upon, the content or products found herein.