
|
Xinjiang Xuefeng Sci-Techco., Ltd (603227.SS) DCF-Bewertung |
Fully Editable: Tailor To Your Needs In Excel Or Sheets
Professional Design: Trusted, Industry-Standard Templates
Investor-Approved Valuation Models
MAC/PC Compatible, Fully Unlocked
No Expertise Is Needed; Easy To Follow
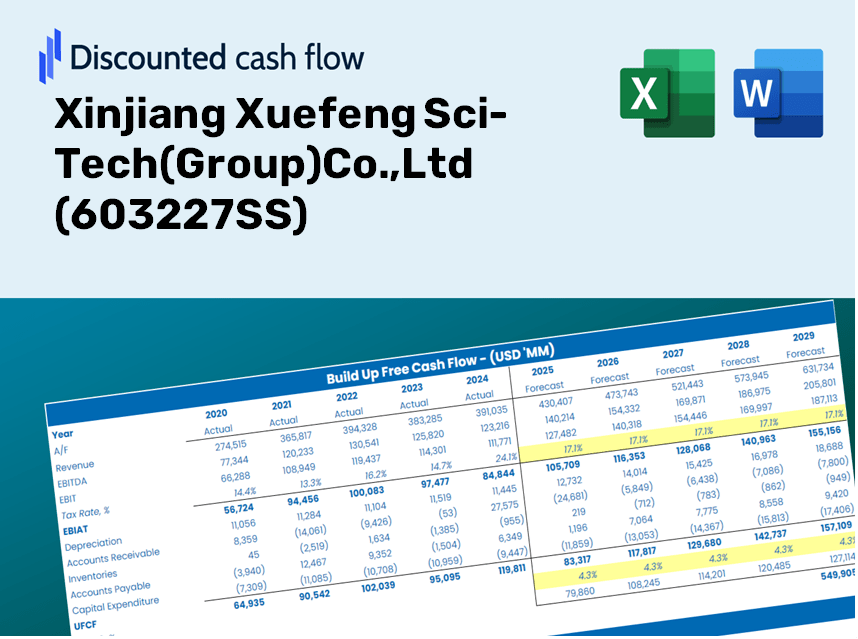
Xinjiang Xuefeng Sci-Tech(Group)Co.,Ltd (603227.SS) Bundle
Unabhängig davon, ob Sie ein Investor oder Analyst sind, ist dieser (603227SS) DCF-Taschenrechner Ihre Anlaufstelle für eine genaue Bewertung. Laden Sie mit echten Daten von Xinjiang Xuefeng Sci-Tech (Group) Co., Ltd, können Sie die Prognosen anpassen und die Auswirkungen in Echtzeit beobachten.
Discounted Cash Flow (DCF) - (USD MM)
| Year | AY1 2020 |
AY2 2021 |
AY3 2022 |
AY4 2023 |
AY5 2024 |
FY1 2025 |
FY2 2026 |
FY3 2027 |
FY4 2028 |
FY5 2029 |
|---|---|---|---|---|---|---|---|---|---|---|
| Revenue | 2,067.1 | 5,568.4 | 6,902.5 | 7,020.9 | 6,101.2 | 7,818.3 | 10,018.7 | 12,838.3 | 16,451.5 | 21,081.6 |
| Revenue Growth, % | 0 | 169.37 | 23.96 | 1.72 | -13.1 | 28.14 | 28.14 | 28.14 | 28.14 | 28.14 |
| EBITDA | 341.7 | 1,673.1 | 1,887.2 | 1,489.3 | 1,284.3 | 1,816.7 | 2,328.0 | 2,983.2 | 3,822.7 | 4,898.6 |
| EBITDA, % | 16.53 | 30.05 | 27.34 | 21.21 | 21.05 | 23.24 | 23.24 | 23.24 | 23.24 | 23.24 |
| Depreciation | 114.8 | 351.6 | 360.8 | 346.0 | 371.5 | 439.6 | 563.3 | 721.9 | 925.1 | 1,185.4 |
| Depreciation, % | 5.55 | 6.32 | 5.23 | 4.93 | 6.09 | 5.62 | 5.62 | 5.62 | 5.62 | 5.62 |
| EBIT | 226.9 | 1,321.5 | 1,526.4 | 1,143.2 | 912.8 | 1,377.1 | 1,764.6 | 2,261.3 | 2,897.7 | 3,713.2 |
| EBIT, % | 10.98 | 23.73 | 22.11 | 16.28 | 14.96 | 17.61 | 17.61 | 17.61 | 17.61 | 17.61 |
| Total Cash | 313.5 | 327.9 | 1,235.9 | 890.4 | 1,004.2 | 1,064.9 | 1,364.6 | 1,748.6 | 2,240.7 | 2,871.3 |
| Total Cash, percent | .0 | .0 | .0 | .0 | .0 | .0 | .0 | .0 | .0 | .0 |
| Account Receivables | 1,192.8 | 1,718.4 | 1,546.1 | 1,359.3 | 1,732.4 | 2,481.8 | 3,180.3 | 4,075.4 | 5,222.4 | 6,692.2 |
| Account Receivables, % | 57.7 | 30.86 | 22.4 | 19.36 | 28.39 | 31.74 | 31.74 | 31.74 | 31.74 | 31.74 |
| Inventories | 193.9 | 207.4 | 618.7 | 504.6 | 447.8 | 572.2 | 733.3 | 939.7 | 1,204.1 | 1,543.0 |
| Inventories, % | 9.38 | 3.72 | 8.96 | 7.19 | 7.34 | 7.32 | 7.32 | 7.32 | 7.32 | 7.32 |
| Accounts Payable | 163.0 | 484.3 | 700.5 | 686.6 | 668.2 | 742.1 | 951.0 | 1,218.6 | 1,561.6 | 2,001.1 |
| Accounts Payable, % | 7.88 | 8.7 | 10.15 | 9.78 | 10.95 | 9.49 | 9.49 | 9.49 | 9.49 | 9.49 |
| Capital Expenditure | -157.9 | -167.7 | -130.5 | -185.7 | -122.1 | -268.7 | -344.4 | -441.3 | -565.5 | -724.6 |
| Capital Expenditure, % | -7.64 | -3.01 | -1.89 | -2.65 | -2 | -3.44 | -3.44 | -3.44 | -3.44 | -3.44 |
| Tax Rate, % | 28.26 | 28.26 | 28.26 | 28.26 | 28.26 | 28.26 | 28.26 | 28.26 | 28.26 | 28.26 |
| EBITAT | 123.7 | 471.7 | 684.0 | 837.0 | 654.8 | 771.1 | 988.1 | 1,266.2 | 1,622.5 | 2,079.2 |
| Depreciation | ||||||||||
| Changes in Account Receivables | ||||||||||
| Changes in Inventories | ||||||||||
| Changes in Accounts Payable | ||||||||||
| Capital Expenditure | ||||||||||
| UFCF | -1,143.1 | 438.0 | 891.4 | 1,284.4 | 569.5 | 142.0 | 556.4 | 713.0 | 913.7 | 1,170.8 |
| WACC, % | 5.12 | 5.07 | 5.1 | 5.17 | 5.17 | 5.13 | 5.13 | 5.13 | 5.13 | 5.13 |
| PV UFCF | ||||||||||
| SUM PV UFCF | 2,912.3 | |||||||||
| Long Term Growth Rate, % | 2.00 | |||||||||
| Free cash flow (T + 1) | 1,194 | |||||||||
| Terminal Value | 38,211 | |||||||||
| Present Terminal Value | 29,762 | |||||||||
| Enterprise Value | 32,674 | |||||||||
| Net Debt | -647 | |||||||||
| Equity Value | 33,321 | |||||||||
| Diluted Shares Outstanding, MM | 1,072 | |||||||||
| Equity Value Per Share | 31.09 |
What You Will Receive
- Customizable Excel Template: A tailor-made Excel DCF Calculator featuring pre-filled financial data for Xinjiang Xuefeng Sci-Tech (603227SS).
- Accurate Data: Access to historical performance data and projected estimates (highlighted in the yellow cells).
- Flexible Forecasting: Adjust key assumptions such as revenue growth, EBITDA margins, and WACC.
- Instant Calculations: Quickly observe how your inputs influence the valuation of Xinjiang Xuefeng Sci-Tech.
- Professional Resource: Designed for investors, CFOs, consultants, and financial analysts.
- Intuitive Interface: Organized for clarity and ease of navigation, complete with step-by-step guidance.
Key Features
- 🔍 Real-Life (603227SS) Financials: Pre-filled historical and projected data for Xinjiang Xuefeng Sci-Tech (Group) Co., Ltd.
- ✏️ Fully Customizable Inputs: Adjust all critical parameters (yellow cells) such as WACC, growth %, and tax rates.
- 📊 Professional DCF Valuation: Integrated formulas determine the intrinsic value of Xinjiang Xuefeng using the Discounted Cash Flow method.
- ⚡ Instant Results: Visualize the valuation of Xinjiang Xuefeng immediately after making adjustments.
- Scenario Analysis: Evaluate and compare outcomes based on different financial assumptions side-by-side.
How It Works
- 1. Access the Template: Download and open the Excel file featuring Xinjiang Xuefeng Sci-Tech (Group) Co., Ltd’s [603227SS] preloaded data.
- 2. Adjust Key Variables: Modify critical inputs such as projected growth rates, WACC, and capital expenditures.
- 3. Analyze Results in Real-Time: The DCF model automatically computes the intrinsic value and NPV for you.
- 4. Explore Different Scenarios: Evaluate various forecasts to uncover diverse valuation possibilities.
- 5. Present with Assurance: Deliver expert valuation insights that reinforce your strategic decisions.
Why Opt for This Calculator from Xinjiang Xuefeng Sci-Tech (603227SS)?
- Time Efficiency: Skip the hassle of building a DCF model from scratch – it's immediately available for use.
- Enhanced Precision: Utilize reliable financial data and formulas to minimize valuation errors.
- Completely Customizable: Adjust the model to align with your specific assumptions and forecasts.
- Intuitive Interpretation: User-friendly charts and outputs simplify result analysis.
- Favored by Professionals: Developed for experts who prioritize accuracy and ease of use.
Who Should Use This Product?
- Individual Investors: Gain insights for making informed decisions about buying or selling shares of Xinjiang Xuefeng Sci-Tech(Group) Co., Ltd (603227SS).
- Financial Analysts: Enhance valuation methods with comprehensive financial models tailored for Xinjiang Xuefeng Sci-Tech(Group) Co., Ltd (603227SS).
- Consultants: Provide clients with precise and swift valuation analyses related to Xinjiang Xuefeng Sci-Tech(Group) Co., Ltd (603227SS).
- Business Owners: Learn about the valuation of large corporations like Xinjiang Xuefeng Sci-Tech(Group) Co., Ltd (603227SS) to inform your own business strategies.
- Finance Students: Acquire practical valuation skills using real data and case studies involving Xinjiang Xuefeng Sci-Tech(Group) Co., Ltd (603227SS).
Contents of the Template
- Operating and Balance Sheet Data: Pre-filled historical data and forecasts for Xinjiang Xuefeng Sci-Tech(Group) Co., Ltd (603227SS), including revenue, EBITDA, EBIT, and capital expenditures.
- WACC Calculation: A specialized sheet for calculating the Weighted Average Cost of Capital (WACC), encompassing parameters such as Beta, risk-free rate, and share price.
- DCF Valuation (Unlevered and Levered): Customizable Discounted Cash Flow models illustrating intrinsic value with comprehensive calculations.
- Financial Statements: Pre-loaded financial statements (annual and quarterly) to facilitate in-depth analysis.
- Key Ratios: Includes profitability, leverage, and efficiency ratios specifically for Xinjiang Xuefeng Sci-Tech(Group) Co., Ltd (603227SS).
- Dashboard and Charts: A visual overview of valuation outputs and assumptions to streamline the analysis process.
Disclaimer
All information, articles, and product details provided on this website are for general informational and educational purposes only. We do not claim any ownership over, nor do we intend to infringe upon, any trademarks, copyrights, logos, brand names, or other intellectual property mentioned or depicted on this site. Such intellectual property remains the property of its respective owners, and any references here are made solely for identification or informational purposes, without implying any affiliation, endorsement, or partnership.
We make no representations or warranties, express or implied, regarding the accuracy, completeness, or suitability of any content or products presented. Nothing on this website should be construed as legal, tax, investment, financial, medical, or other professional advice. In addition, no part of this site—including articles or product references—constitutes a solicitation, recommendation, endorsement, advertisement, or offer to buy or sell any securities, franchises, or other financial instruments, particularly in jurisdictions where such activity would be unlawful.
All content is of a general nature and may not address the specific circumstances of any individual or entity. It is not a substitute for professional advice or services. Any actions you take based on the information provided here are strictly at your own risk. You accept full responsibility for any decisions or outcomes arising from your use of this website and agree to release us from any liability in connection with your use of, or reliance upon, the content or products found herein.