
|
Grace Fabric Technology Co., Ltd. (603256.SS) DCF -Bewertung |
Fully Editable: Tailor To Your Needs In Excel Or Sheets
Professional Design: Trusted, Industry-Standard Templates
Investor-Approved Valuation Models
MAC/PC Compatible, Fully Unlocked
No Expertise Is Needed; Easy To Follow
Grace Fabric Technology Co.,Ltd. (603256.SS) Bundle
Bewerten Sie die finanziellen Aussichten von Grace Fabric Technology Co., Ltd., wie ein Experte! Dieser (603256SS) DCF-Taschenrechner bietet vorgefüllte Finanzdaten sowie die Flexibilität, das Umsatzwachstum, WACC, Margen und andere wesentliche Annahmen für Ihre Projektionen zu ändern.
Discounted Cash Flow (DCF) - (USD MM)
| Year | AY1 2020 |
AY2 2021 |
AY3 2022 |
AY4 2023 |
AY5 2024 |
FY1 2025 |
FY2 2026 |
FY3 2027 |
FY4 2028 |
FY5 2029 |
|---|---|---|---|---|---|---|---|---|---|---|
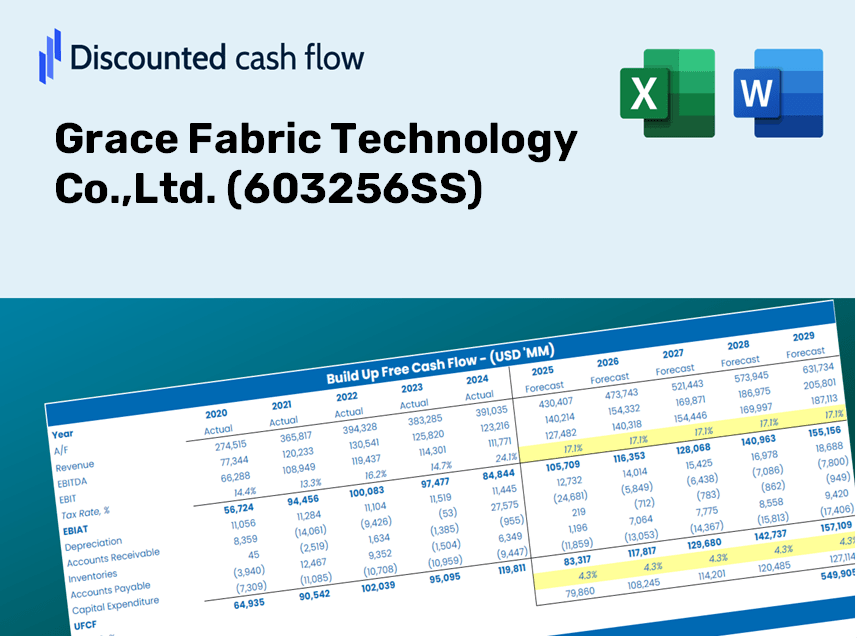
| Revenue | 620.6 | 808.2 | 612.1 | 661.2 | 834.6 | 898.2 | 966.7 | 1,040.4 | 1,119.7 | 1,205.0 |
| Revenue Growth, % | 0 | 30.23 | -24.26 | 8.01 | 26.24 | 7.62 | 7.62 | 7.62 | 7.62 | 7.62 |
| EBITDA | 166.5 | 235.4 | 162.4 | 57.2 | 163.4 | 198.9 | 214.1 | 230.4 | 247.9 | 266.8 |
| EBITDA, % | 26.84 | 29.13 | 26.53 | 8.66 | 19.57 | 22.14 | 22.14 | 22.14 | 22.14 | 22.14 |
| Depreciation | 24.4 | 64.9 | 70.0 | 93.3 | 108.7 | 90.8 | 97.7 | 105.1 | 113.1 | 121.8 |
| Depreciation, % | 3.93 | 8.04 | 11.43 | 14.1 | 13.02 | 10.11 | 10.11 | 10.11 | 10.11 | 10.11 |
| EBIT | 142.2 | 170.4 | 92.4 | -36.0 | 54.7 | 108.1 | 116.4 | 125.2 | 134.8 | 145.1 |
| EBIT, % | 22.91 | 21.09 | 15.09 | -5.45 | 6.55 | 12.04 | 12.04 | 12.04 | 12.04 | 12.04 |
| Total Cash | 700.2 | 366.9 | 419.0 | 231.6 | 287.2 | 508.9 | 547.7 | 589.5 | 634.4 | 682.7 |
| Total Cash, percent | .0 | .0 | .0 | .0 | .0 | .0 | .0 | .0 | .0 | .0 |
| Account Receivables | 276.0 | 369.7 | 285.0 | 376.5 | 421.5 | 438.8 | 472.2 | 508.2 | 546.9 | 588.6 |
| Account Receivables, % | 44.48 | 45.74 | 46.56 | 56.94 | 50.51 | 48.85 | 48.85 | 48.85 | 48.85 | 48.85 |
| Inventories | 112.2 | 136.0 | 173.5 | 224.5 | 175.6 | 212.4 | 228.6 | 246.0 | 264.8 | 285.0 |
| Inventories, % | 18.08 | 16.83 | 28.34 | 33.96 | 21.04 | 23.65 | 23.65 | 23.65 | 23.65 | 23.65 |
| Accounts Payable | 74.9 | 68.4 | 57.0 | 78.5 | 59.6 | 87.8 | 94.5 | 101.6 | 109.4 | 117.7 |
| Accounts Payable, % | 12.06 | 8.47 | 9.32 | 11.87 | 7.14 | 9.77 | 9.77 | 9.77 | 9.77 | 9.77 |
| Capital Expenditure | -312.4 | -554.9 | -286.1 | -180.6 | -33.9 | -354.1 | -381.1 | -410.2 | -441.4 | -475.1 |
| Capital Expenditure, % | -50.34 | -68.67 | -46.74 | -27.31 | -4.06 | -39.42 | -39.42 | -39.42 | -39.42 | -39.42 |
| Tax Rate, % | -15.08 | -15.08 | -15.08 | -15.08 | -15.08 | -15.08 | -15.08 | -15.08 | -15.08 | -15.08 |
| EBITAT | 124.7 | 150.8 | 83.6 | -33.4 | 62.9 | 99.4 | 107.0 | 115.1 | 123.9 | 133.3 |
| Depreciation | ||||||||||
| Changes in Account Receivables | ||||||||||
| Changes in Inventories | ||||||||||
| Changes in Accounts Payable | ||||||||||
| Capital Expenditure | ||||||||||
| UFCF | -476.6 | -463.1 | -96.7 | -241.8 | 122.7 | -189.8 | -219.4 | -236.1 | -254.1 | -273.5 |
| WACC, % | 5.26 | 5.27 | 5.27 | 5.27 | 5.28 | 5.27 | 5.27 | 5.27 | 5.27 | 5.27 |
| PV UFCF | ||||||||||
| SUM PV UFCF | -999.2 | |||||||||
| Long Term Growth Rate, % | 4.00 | |||||||||
| Free cash flow (T + 1) | -284 | |||||||||
| Terminal Value | -22,398 | |||||||||
| Present Terminal Value | -17,326 | |||||||||
| Enterprise Value | -18,325 | |||||||||
| Net Debt | 478 | |||||||||
| Equity Value | -18,803 | |||||||||
| Diluted Shares Outstanding, MM | 760 | |||||||||
| Equity Value Per Share | -24.74 |
What You Will Receive
- Accurate GFT Financial Data: Pre-loaded with Grace Fabric Technology’s historical and projected figures for detailed analysis.
- Fully Customizable Template: Easily adjust critical inputs such as revenue growth, WACC, and EBITDA percentage.
- Real-Time Calculations: Instantly view updates to GFT’s intrinsic value as you make modifications.
- Professional Valuation Tool: Tailored for investors, analysts, and consultants looking for reliable DCF outcomes.
- User-Friendly Interface: Intuitive design and straightforward guidelines suitable for all levels of experience.
Key Features
- Comprehensive Data: Grace Fabric Technology Co., Ltd.'s historical financial statements and pre-filled projections.
- Customizable Inputs: Modify WACC, tax rates, revenue growth, and EBITDA margins as needed.
- Real-Time Analysis: View the intrinsic value of Grace Fabric Technology Co., Ltd. (603256SS) update instantly.
- Intuitive Visualizations: Dashboard charts present valuation outcomes and essential metrics clearly.
- Designed for Precision: A robust tool tailored for analysts, investors, and finance professionals.
How It Works
- Step 1: Download the Excel template for Grace Fabric Technology Co., Ltd. (603256SS).
- Step 2: Examine the pre-filled financial data and projections related to Grace Fabric Technology.
- Step 3: Adjust essential inputs such as revenue growth, WACC, and tax rates (highlighted cells).
- Step 4: Observe the DCF model update in real-time as you alter your assumptions.
- Step 5: Evaluate the generated outputs and leverage the findings for informed investment decisions.
Why Choose Grace Fabric Technology Co., Ltd. (603256SS)?
- Designed for Industry Experts: A sophisticated tool preferred by fabric technologists, product managers, and consultants.
- Comprehensive Data: Historical and projected metrics of Grace Fabric Technology preloaded for precision.
- Versatile Scenario Analysis: Effortlessly model various forecasts and assumptions.
- Intuitive Outputs: Automatically determines key performance indicators and financial metrics.
- User-Friendly: Step-by-step guidance simplifies the entire calculation process.
Who Can Benefit from Grace Fabric Technology Co., Ltd.?
- Professional Investors: Develop comprehensive and trustworthy valuation models for investment analysis of Grace Fabric Technology (603256SS).
- Corporate Finance Teams: Evaluate valuation scenarios to inform and steer internal strategies for Grace Fabric Technology (603256SS).
- Consultants and Advisors: Offer clients precise valuation insights related to Grace Fabric Technology (603256SS).
- Students and Educators: Utilize real-world data to learn and teach financial modeling with a focus on Grace Fabric Technology (603256SS).
- Textile Industry Enthusiasts: Gain insights into how companies like Grace Fabric Technology (603256SS) are valued in the marketplace.
Contents of the Template
- Preloaded Grace Fabric Data: Historical and projected financial information, including revenue, EBIT, and capital expenditures.
- DCF and WACC Models: Advanced sheets for determining intrinsic value and Weighted Average Cost of Capital.
- Editable Inputs: Cells highlighted in yellow for modifying revenue growth, tax rates, and discount rates.
- Financial Statements: Detailed annual and quarterly financial reports for thorough analysis.
- Key Ratios: Metrics on profitability, leverage, and efficiency to assess performance.
- Dashboard and Charts: Visual representations of valuation results and assumptions.
Disclaimer
All information, articles, and product details provided on this website are for general informational and educational purposes only. We do not claim any ownership over, nor do we intend to infringe upon, any trademarks, copyrights, logos, brand names, or other intellectual property mentioned or depicted on this site. Such intellectual property remains the property of its respective owners, and any references here are made solely for identification or informational purposes, without implying any affiliation, endorsement, or partnership.
We make no representations or warranties, express or implied, regarding the accuracy, completeness, or suitability of any content or products presented. Nothing on this website should be construed as legal, tax, investment, financial, medical, or other professional advice. In addition, no part of this site—including articles or product references—constitutes a solicitation, recommendation, endorsement, advertisement, or offer to buy or sell any securities, franchises, or other financial instruments, particularly in jurisdictions where such activity would be unlawful.
All content is of a general nature and may not address the specific circumstances of any individual or entity. It is not a substitute for professional advice or services. Any actions you take based on the information provided here are strictly at your own risk. You accept full responsibility for any decisions or outcomes arising from your use of this website and agree to release us from any liability in connection with your use of, or reliance upon, the content or products found herein.