
|
Guangdong Songfa Ceramics Co., Ltd. (603268.SS) DCF -Bewertung |
Fully Editable: Tailor To Your Needs In Excel Or Sheets
Professional Design: Trusted, Industry-Standard Templates
Investor-Approved Valuation Models
MAC/PC Compatible, Fully Unlocked
No Expertise Is Needed; Easy To Follow
Guangdong Songfa Ceramics Co.,Ltd. (603268.SS) Bundle
Egal, ob Sie ein Investor oder Analyst sind, dieser DCF-Taschenrechner (603268S) ist Ihre Anlaufstelle für eine genaue Bewertung. Mit echten Daten von Guangdong Songfa Ceramics Co., Ltd., können Sie Vorhersagen anpassen und die Effekte in Echtzeit beobachten.
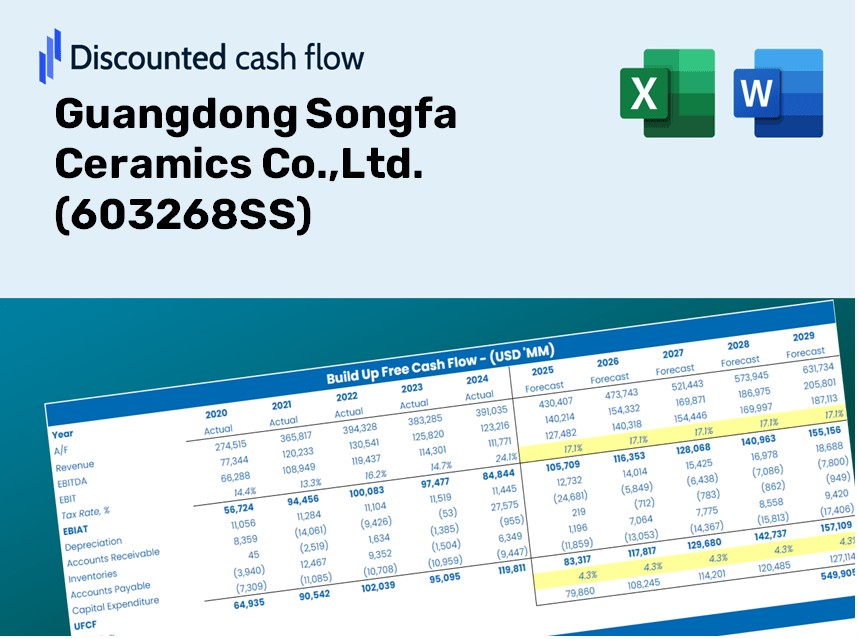
Discounted Cash Flow (DCF) - (USD MM)
| Year | AY1 2020 |
AY2 2021 |
AY3 2022 |
AY4 2023 |
AY5 2024 |
FY1 2025 |
FY2 2026 |
FY3 2027 |
FY4 2028 |
FY5 2029 |
|---|---|---|---|---|---|---|---|---|---|---|
| Revenue | 446.3 | 403.0 | 270.8 | 206.1 | 274.8 | 252.1 | 231.3 | 212.1 | 194.6 | 178.5 |
| Revenue Growth, % | 0 | -9.71 | -32.79 | -23.9 | 33.34 | -8.27 | -8.27 | -8.27 | -8.27 | -8.27 |
| EBITDA | 83.7 | -23.7 | -89.9 | -52.1 | -29.2 | -28.4 | -26.0 | -23.9 | -21.9 | -20.1 |
| EBITDA, % | 18.75 | -5.87 | -33.2 | -25.29 | -10.61 | -11.25 | -11.25 | -11.25 | -11.25 | -11.25 |
| Depreciation | 35.1 | 34.5 | 33.3 | 30.7 | 26.7 | 26.9 | 24.7 | 22.6 | 20.8 | 19.0 |
| Depreciation, % | 7.86 | 8.56 | 12.28 | 14.92 | 9.71 | 10.67 | 10.67 | 10.67 | 10.67 | 10.67 |
| EBIT | 48.6 | -58.2 | -123.2 | -82.9 | -55.9 | -55.2 | -50.7 | -46.5 | -42.6 | -39.1 |
| EBIT, % | 10.88 | -14.43 | -45.48 | -40.21 | -20.33 | -21.91 | -21.91 | -21.91 | -21.91 | -21.91 |
| Total Cash | 52.8 | 33.1 | 25.8 | 18.1 | 10.5 | 21.3 | 19.5 | 17.9 | 16.4 | 15.1 |
| Total Cash, percent | .0 | .0 | .0 | .0 | .0 | .0 | .0 | .0 | .0 | .0 |
| Account Receivables | 203.0 | 158.0 | 128.3 | 94.3 | 130.6 | 113.6 | 104.2 | 95.6 | 87.7 | 80.5 |
| Account Receivables, % | 45.47 | 39.22 | 47.39 | 45.74 | 47.53 | 45.07 | 45.07 | 45.07 | 45.07 | 45.07 |
| Inventories | 193.9 | 199.7 | 159.3 | 158.3 | 163.0 | 145.2 | 133.2 | 122.2 | 112.1 | 102.8 |
| Inventories, % | 43.45 | 49.56 | 58.84 | 76.82 | 59.33 | 57.6 | 57.6 | 57.6 | 57.6 | 57.6 |
| Accounts Payable | 38.2 | 49.8 | 47.5 | 42.7 | 53.2 | 39.6 | 36.3 | 33.3 | 30.6 | 28.0 |
| Accounts Payable, % | 8.57 | 12.36 | 17.54 | 20.72 | 19.35 | 15.71 | 15.71 | 15.71 | 15.71 | 15.71 |
| Capital Expenditure | -10.5 | -33.0 | -6.7 | -8.1 | -5.6 | -9.6 | -8.8 | -8.0 | -7.4 | -6.8 |
| Capital Expenditure, % | -2.35 | -8.18 | -2.47 | -3.91 | -2.05 | -3.79 | -3.79 | -3.79 | -3.79 | -3.79 |
| Tax Rate, % | -1.04 | -1.04 | -1.04 | -1.04 | -1.04 | -1.04 | -1.04 | -1.04 | -1.04 | -1.04 |
| EBITAT | 3.5 | -55.8 | -119.5 | -81.4 | -56.4 | -44.0 | -40.4 | -37.0 | -34.0 | -31.2 |
| Depreciation | ||||||||||
| Changes in Account Receivables | ||||||||||
| Changes in Inventories | ||||||||||
| Changes in Accounts Payable | ||||||||||
| Capital Expenditure | ||||||||||
| UFCF | -330.5 | -3.6 | -25.1 | -28.4 | -66.0 | -5.4 | -6.4 | -5.8 | -5.4 | -4.9 |
| WACC, % | 4.57 | 4.86 | 4.86 | 4.87 | 4.87 | 4.81 | 4.81 | 4.81 | 4.81 | 4.81 |
| PV UFCF | ||||||||||
| SUM PV UFCF | -24.4 | |||||||||
| Long Term Growth Rate, % | 2.00 | |||||||||
| Free cash flow (T + 1) | -5 | |||||||||
| Terminal Value | -179 | |||||||||
| Present Terminal Value | -141 | |||||||||
| Enterprise Value | -166 | |||||||||
| Net Debt | 155 | |||||||||
| Equity Value | -321 | |||||||||
| Diluted Shares Outstanding, MM | 124 | |||||||||
| Equity Value Per Share | -2.58 |
Benefits You Will Receive
- Pre-Filled Financial Model: Leverage Guangdong Songfa Ceramics Co., Ltd.’s actual data for accurate DCF valuation.
- Comprehensive Forecast Control: Modify revenue growth, profit margins, WACC, and other essential metrics.
- Real-Time Calculations: Automatic updates provide immediate insights as adjustments are made.
- Professional-Grade Template: A polished Excel file crafted for expert-level valuation.
- Flexible and Reusable: Designed for adaptability, allowing for repeated use in detailed forecasting.
Key Features
- Customizable Forecast Variables: Adjust essential factors such as sales growth, profit margins, and investment expenditures.
- Instant DCF Valuation: Automatically computes intrinsic value, net present value, and other financial metrics.
- High-Precision Accuracy: Incorporates Guangdong Songfa Ceramics Co., Ltd.'s real financial data for credible valuation results.
- User-Friendly Scenario Analysis: Effortlessly explore various assumptions and evaluate their impacts.
- Efficiency-Boosting Tool: Avoid the hassle of building intricate valuation models from the ground up.
How It Works
- Step 1: Download the Excel file.
- Step 2: Review the pre-populated data for Guangdong Songfa Ceramics Co., Ltd. (603268SS) including historical and projected figures.
- Step 3: Modify the key assumptions (highlighted in yellow) based on your insights.
- Step 4: Observe the automatic recalculations of the intrinsic value for Guangdong Songfa Ceramics Co., Ltd. (603268SS).
- Step 5: Utilize the results for investment strategies or reporting needs.
Reasons to Choose Our Financial Calculator for Guangdong Songfa Ceramics Co., Ltd. (603268SS)
- All-in-One Solution: Features DCF, WACC, and a range of financial ratio analyses all integrated into one tool.
- Flexible Input Options: Modify the highlighted cells to explore different financial scenarios.
- In-Depth Analysis: Automatically computes the intrinsic value and Net Present Value for Guangdong Songfa Ceramics.
- Integrated Data Sets: Access to historical and projected data for precise calculations.
- Designed for Professionals: Perfect for financial analysts, investors, and business consultants alike.
Who Should Utilize This Product?
- Finance Students: Explore valuation methodologies and practice applying them with actual data related to Guangdong Songfa Ceramics Co., Ltd. (603268SS).
- Researchers: Integrate established financial models into your studies or scholarly projects involving ceramics companies.
- Investors: Validate your investment hypotheses and assess valuation results for Guangdong Songfa Ceramics Co., Ltd. (603268SS).
- Financial Analysts: Enhance efficiency with a ready-to-use, customizable DCF model tailored for ceramics industry analysis.
- Small Business Owners: Discover how major public companies like Guangdong Songfa Ceramics Co., Ltd. (603268SS) are evaluated and what insights can be drawn.
What the Template Includes
- Pre-Filled DCF Model: Guangdong Songfa Ceramics Co., Ltd.'s financial data preloaded for immediate application.
- WACC Calculator: Comprehensive calculations for the Weighted Average Cost of Capital.
- Financial Ratios: Assess Guangdong Songfa's profitability, leverage, and operational efficiency.
- Editable Inputs: Customize assumptions such as growth rates, margins, and capital expenditures to suit your analysis.
- Financial Statements: Access annual and quarterly reports to facilitate in-depth analysis.
- Interactive Dashboard: Effortlessly visualize essential valuation metrics and outcomes.
Disclaimer
All information, articles, and product details provided on this website are for general informational and educational purposes only. We do not claim any ownership over, nor do we intend to infringe upon, any trademarks, copyrights, logos, brand names, or other intellectual property mentioned or depicted on this site. Such intellectual property remains the property of its respective owners, and any references here are made solely for identification or informational purposes, without implying any affiliation, endorsement, or partnership.
We make no representations or warranties, express or implied, regarding the accuracy, completeness, or suitability of any content or products presented. Nothing on this website should be construed as legal, tax, investment, financial, medical, or other professional advice. In addition, no part of this site—including articles or product references—constitutes a solicitation, recommendation, endorsement, advertisement, or offer to buy or sell any securities, franchises, or other financial instruments, particularly in jurisdictions where such activity would be unlawful.
All content is of a general nature and may not address the specific circumstances of any individual or entity. It is not a substitute for professional advice or services. Any actions you take based on the information provided here are strictly at your own risk. You accept full responsibility for any decisions or outcomes arising from your use of this website and agree to release us from any liability in connection with your use of, or reliance upon, the content or products found herein.