
|
G-Bits Network Technology Co., Ltd. (6034444.Sss) DCF-Bewertung |
Fully Editable: Tailor To Your Needs In Excel Or Sheets
Professional Design: Trusted, Industry-Standard Templates
Investor-Approved Valuation Models
MAC/PC Compatible, Fully Unlocked
No Expertise Is Needed; Easy To Follow
G-bits Network Technology (Xiamen) Co., Ltd. (603444.SS) Bundle
Streamline G-Bits Network Technology (Xiamen) Co., Ltd. (603444SS) Bewertung mit diesem anpassbaren DCF-Taschenrechner! Ausgestattet mit echten G-Bits-Finanzdaten und einstellbaren Prognoseeingaben können Sie verschiedene Szenarien untersuchen und in nur wenigen Minuten den fairen Wert von G-Bits aufzeigen.
Benefits You Will Receive
- Adjustable Forecast Inputs: Easily modify key assumptions (growth %, margins, WACC) to explore various scenarios.
- Current Market Data: G-bits Network Technology’s financial data is pre-filled to facilitate your analysis.
- Automated DCF Calculations: The model computes Net Present Value (NPV) and intrinsic value automatically.
- Flexible and Professional Design: A refined Excel template that meets your valuation requirements.
- Tailored for Analysts and Investors: Perfect for evaluating forecasts, confirming strategies, and increasing efficiency.
Key Features
- Customizable Network Settings: Adjust essential parameters such as bandwidth allocation, latency thresholds, and security protocols.
- Instant Network Performance Analysis: Quickly evaluates network efficiency and provides real-time performance metrics.
- Enterprise-Level Precision: Leverages G-bits' industry-standard data for accurate network assessments and forecasts.
- Effortless Scenario Simulation: Easily explore various configurations and analyze the resulting performance differences.
- Efficiency Boosting Solution: Streamlines the process, eliminating the need to create intricate network models from the ground up.
How It Operates
- Download: Obtain the ready-to-use Excel file containing G-bits Network Technology’s (603444SS) financial information.
- Customize: Modify forecasts, including revenue growth, EBITDA %, and WACC to suit your analysis.
- Update Automatically: Enjoy real-time updates on intrinsic value and NPV calculations.
- Test Scenarios: Generate various projections and analyze outcomes immediately.
- Make Decisions: Leverage the valuation results to inform your investment strategy.
Why Choose This Calculator for G-bits Network Technology (603444SS)?
- Designed for Experts: A sophisticated tool utilized by analysts, CFOs, and industry consultants.
- Accurate Data: G-bits Network Technology’s historical and projected financials are preloaded for precision.
- Flexible Scenario Analysis: Effortlessly simulate various forecasts and assumptions.
- Comprehensive Results: Instantly computes intrinsic value, NPV, and essential financial metrics.
- User-Friendly: Detailed step-by-step instructions to help you navigate the process.
Who Can Benefit from This Product?
- Investors: Evaluate G-bits Network Technology's [603444SS] valuation prior to making stock transactions.
- CFOs and Financial Analysts: Optimize valuation methodologies and validate financial forecasts.
- Startup Founders: Gain insights into the valuation processes of established tech companies like G-bits.
- Consultants: Create detailed valuation reports to serve your clients better.
- Students and Educators: Employ actual market data to practice and illustrate valuation strategies.
Contents of the Template
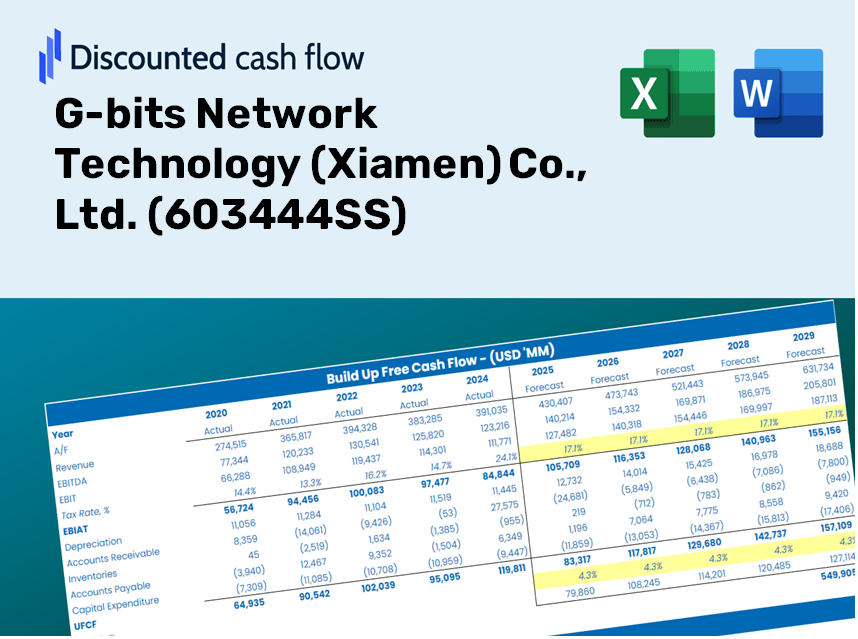
- Preloaded G-bits Data: Historical and projected financial metrics, featuring revenue, EBIT, and capital expenditures.
- DCF and WACC Models: Professional-grade worksheets for determining intrinsic value and Weighted Average Cost of Capital.
- Editable Inputs: Yellow-highlighted fields for customizing revenue growth, tax rates, and discount rates.
- Financial Statements: Detailed annual and quarterly financial reports for in-depth analysis.
- Key Ratios: Profitability, leverage, and efficiency ratios to assess company performance.
- Dashboard and Charts: Visual representations of valuation results and underlying assumptions.
Disclaimer
All information, articles, and product details provided on this website are for general informational and educational purposes only. We do not claim any ownership over, nor do we intend to infringe upon, any trademarks, copyrights, logos, brand names, or other intellectual property mentioned or depicted on this site. Such intellectual property remains the property of its respective owners, and any references here are made solely for identification or informational purposes, without implying any affiliation, endorsement, or partnership.
We make no representations or warranties, express or implied, regarding the accuracy, completeness, or suitability of any content or products presented. Nothing on this website should be construed as legal, tax, investment, financial, medical, or other professional advice. In addition, no part of this site—including articles or product references—constitutes a solicitation, recommendation, endorsement, advertisement, or offer to buy or sell any securities, franchises, or other financial instruments, particularly in jurisdictions where such activity would be unlawful.
All content is of a general nature and may not address the specific circumstances of any individual or entity. It is not a substitute for professional advice or services. Any actions you take based on the information provided here are strictly at your own risk. You accept full responsibility for any decisions or outcomes arising from your use of this website and agree to release us from any liability in connection with your use of, or reliance upon, the content or products found herein.