
|
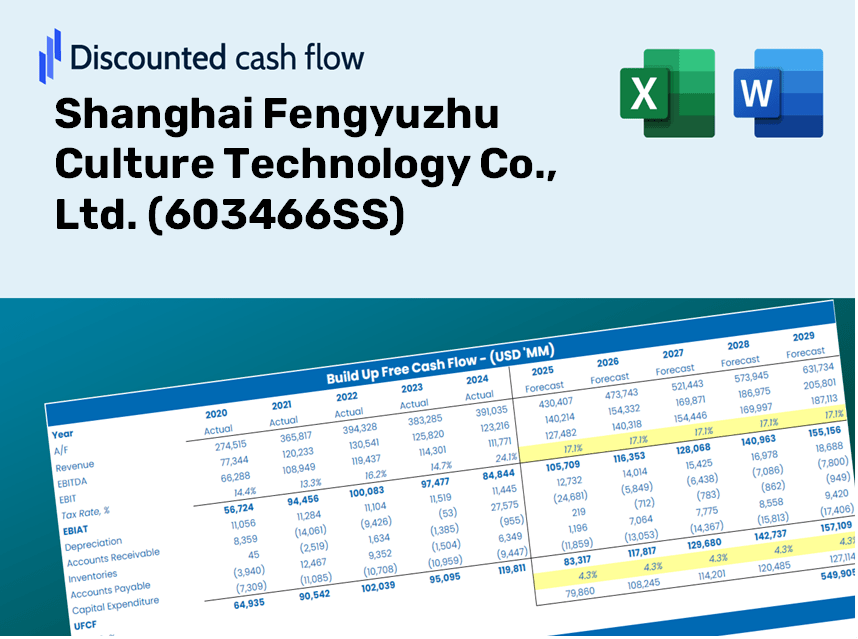
Shanghai Fengyuzhu Culture Technology Co., Ltd. (603466.SS) DCF -Bewertung |
Fully Editable: Tailor To Your Needs In Excel Or Sheets
Professional Design: Trusted, Industry-Standard Templates
Investor-Approved Valuation Models
MAC/PC Compatible, Fully Unlocked
No Expertise Is Needed; Easy To Follow
Shanghai Fengyuzhu Culture Technology Co., Ltd. (603466.SS) Bundle
Egal, ob Sie ein Investor oder Analyst sind, dieser DCF-Taschenrechner (603466S) ist Ihre Anlaufstelle für eine genaue Bewertung. Mit echten Daten von Shanghai Fengyuzhu Culture Technology Co., Ltd. können Sie Prognosen problemlos anpassen und die Auswirkungen sofort beobachten.
Discounted Cash Flow (DCF) - (USD MM)
| Year | AY1 2020 |
AY2 2021 |
AY3 2022 |
AY4 2023 |
AY5 2024 |
FY1 2025 |
FY2 2026 |
FY3 2027 |
FY4 2028 |
FY5 2029 |
|---|---|---|---|---|---|---|---|---|---|---|
| Revenue | 2,256.3 | 2,939.9 | 1,681.9 | 2,350.5 | 1,376.4 | 1,327.6 | 1,280.5 | 1,235.1 | 1,191.3 | 1,149.1 |
| Revenue Growth, % | 0 | 30.3 | -42.79 | 39.75 | -41.44 | -3.55 | -3.55 | -3.55 | -3.55 | -3.55 |
| EBITDA | 417.7 | 530.1 | 110.8 | 208.5 | -123.7 | 114.2 | 110.2 | 106.3 | 102.5 | 98.9 |
| EBITDA, % | 18.51 | 18.03 | 6.59 | 8.87 | -8.99 | 8.6 | 8.6 | 8.6 | 8.6 | 8.6 |
| Depreciation | 26.2 | 23.7 | 18.1 | 14.9 | 16.1 | 12.9 | 12.4 | 12.0 | 11.6 | 11.1 |
| Depreciation, % | 1.16 | 0.80628 | 1.08 | 0.6353 | 1.17 | 0.96969 | 0.96969 | 0.96969 | 0.96969 | 0.96969 |
| EBIT | 391.5 | 506.4 | 92.7 | 193.5 | -139.8 | 101.3 | 97.7 | 94.3 | 90.9 | 87.7 |
| EBIT, % | 17.35 | 17.23 | 5.51 | 8.23 | -10.16 | 7.63 | 7.63 | 7.63 | 7.63 | 7.63 |
| Total Cash | 1,436.9 | 1,606.8 | 2,109.6 | 2,091.4 | 1,795.2 | 1,081.5 | 1,043.1 | 1,006.2 | 970.5 | 936.1 |
| Total Cash, percent | .0 | .0 | .0 | .0 | .0 | .0 | .0 | .0 | .0 | .0 |
| Account Receivables | 1,494.9 | 1,644.5 | 1,632.6 | 1,719.0 | 1,561.9 | 1,041.9 | 1,004.9 | 969.3 | 934.9 | 901.8 |
| Account Receivables, % | 66.25 | 55.94 | 97.07 | 73.13 | 113.47 | 78.48 | 78.48 | 78.48 | 78.48 | 78.48 |
| Inventories | 892.8 | 553.3 | 699.2 | 365.7 | 579.2 | 418.5 | 403.6 | 389.3 | 375.5 | 362.2 |
| Inventories, % | 39.57 | 18.82 | 41.57 | 15.56 | 42.08 | 31.52 | 31.52 | 31.52 | 31.52 | 31.52 |
| Accounts Payable | 820.2 | 929.7 | 1,073.6 | 1,039.5 | 906.9 | 642.3 | 619.6 | 597.6 | 576.4 | 556.0 |
| Accounts Payable, % | 36.35 | 31.62 | 63.83 | 44.23 | 65.89 | 48.38 | 48.38 | 48.38 | 48.38 | 48.38 |
| Capital Expenditure | -8.1 | -4.2 | -.8 | -4.6 | -.2 | -2.0 | -2.0 | -1.9 | -1.8 | -1.8 |
| Capital Expenditure, % | -0.35994 | -0.14381 | -0.0486948 | -0.19565 | -0.0176174 | -0.15314 | -0.15314 | -0.15314 | -0.15314 | -0.15314 |
| Tax Rate, % | 17.23 | 17.23 | 17.23 | 17.23 | 17.23 | 17.23 | 17.23 | 17.23 | 17.23 | 17.23 |
| EBITAT | 343.1 | 438.5 | 80.6 | 172.4 | -115.7 | 87.8 | 84.6 | 81.6 | 78.7 | 76.0 |
| Depreciation | ||||||||||
| Changes in Account Receivables | ||||||||||
| Changes in Inventories | ||||||||||
| Changes in Accounts Payable | ||||||||||
| Capital Expenditure | ||||||||||
| UFCF | -1,206.3 | 757.3 | 107.7 | 395.8 | -288.9 | 514.8 | 124.1 | 119.7 | 115.5 | 111.4 |
| WACC, % | 7.86 | 7.86 | 7.86 | 7.87 | 7.84 | 7.86 | 7.86 | 7.86 | 7.86 | 7.86 |
| PV UFCF | ||||||||||
| SUM PV UFCF | 840.9 | |||||||||
| Long Term Growth Rate, % | 4.00 | |||||||||
| Free cash flow (T + 1) | 116 | |||||||||
| Terminal Value | 3,000 | |||||||||
| Present Terminal Value | 2,055 | |||||||||
| Enterprise Value | 2,896 | |||||||||
| Net Debt | -1,047 | |||||||||
| Equity Value | 3,943 | |||||||||
| Diluted Shares Outstanding, MM | 589 | |||||||||
| Equity Value Per Share | 6.70 |
What You Will Receive
- Authentic (603466SS) Financial Data: Pre-loaded with historical and projected information for comprehensive analysis.
- Customizable Template: Easily adjust key inputs such as revenue growth, WACC, and EBITDA percentage.
- Instant Calculations: Watch the intrinsic value of (603466SS) update in real-time as you make adjustments.
- Professional Valuation Tool: Crafted for investors, analysts, and consultants aiming for precise DCF outcomes.
- User-Friendly Layout: Intuitive design and straightforward instructions suitable for all skill levels.
Key Features
- Pre-Loaded Data: Historical financial statements and pre-filled forecasts for Shanghai Fengyuzhu Culture Technology Co., Ltd. (603466SS).
- Fully Adjustable Inputs: Modify WACC, tax rates, revenue growth, and EBITDA margins as needed.
- Instant Results: View the intrinsic value of Shanghai Fengyuzhu recalculate in real time.
- Clear Visual Outputs: Dashboard charts present valuation results and essential metrics.
- Built for Accuracy: A professional-grade tool designed for analysts, investors, and finance professionals.
Process Overview
- 1. Access the Template: Download and open the Excel file containing Shanghai Fengyuzhu Culture Technology Co., Ltd.'s (603466SS) preloaded data.
- 2. Adjust Assumptions: Modify essential inputs such as growth rates, WACC, and capital expenditures.
- 3. See Instant Results: The DCF model automatically computes the intrinsic value and NPV.
- 4. Explore Different Scenarios: Analyze various forecasts to evaluate different valuation results.
- 5. Present with Assurance: Share professional valuation insights to bolster your decision-making process.
Why Opt for Our Calculator?
- Designed for Experts: A sophisticated tool utilized by industry specialists, executives, and advisors.
- Accurate Data: Comprehensive historical and projected financials for Shanghai Fengyuzhu Culture Technology Co., Ltd. (603466SS) preloaded for enhanced precision.
- Flexible Scenario Analysis: Easily model various forecasts and assumptions to test different outcomes.
- Comprehensive Outputs: Automatically derives intrinsic value, NPV, and other essential metrics.
- User-Friendly: Clear, step-by-step instructions help you navigate the calculation process effortlessly.
Who Should Utilize This Service?
- Individual Investors: Gain valuable insights for making informed decisions about investing in Shanghai Fengyuzhu Culture Technology Co., Ltd. (603466SS).
- Financial Analysts: Enhance valuation accuracy with comprehensive financial models tailored to the culture technology sector.
- Consultants: Provide clients with timely and precise valuation analyses and recommendations.
- Business Owners: Learn from the valuation strategies of leading companies like Shanghai Fengyuzhu to refine your own business approach.
- Finance Students: Explore real-world valuation methodologies using actual data from Shanghai Fengyuzhu Culture Technology Co., Ltd. (603466SS).
What the Template Contains
- Pre-Filled DCF Model: Shanghai Fengyuzhu Culture Technology Co., Ltd.’s financial data preloaded for immediate use.
- WACC Calculator: Detailed calculations for Weighted Average Cost of Capital.
- Financial Ratios: Assess Shanghai Fengyuzhu's profitability, leverage, and efficiency.
- Editable Inputs: Modify assumptions such as growth, margins, and CAPEX to match your scenarios.
- Financial Statements: Annual and quarterly reports to facilitate in-depth analysis.
- Interactive Dashboard: Easily visualize key valuation metrics and outcomes.
Disclaimer
All information, articles, and product details provided on this website are for general informational and educational purposes only. We do not claim any ownership over, nor do we intend to infringe upon, any trademarks, copyrights, logos, brand names, or other intellectual property mentioned or depicted on this site. Such intellectual property remains the property of its respective owners, and any references here are made solely for identification or informational purposes, without implying any affiliation, endorsement, or partnership.
We make no representations or warranties, express or implied, regarding the accuracy, completeness, or suitability of any content or products presented. Nothing on this website should be construed as legal, tax, investment, financial, medical, or other professional advice. In addition, no part of this site—including articles or product references—constitutes a solicitation, recommendation, endorsement, advertisement, or offer to buy or sell any securities, franchises, or other financial instruments, particularly in jurisdictions where such activity would be unlawful.
All content is of a general nature and may not address the specific circumstances of any individual or entity. It is not a substitute for professional advice or services. Any actions you take based on the information provided here are strictly at your own risk. You accept full responsibility for any decisions or outcomes arising from your use of this website and agree to release us from any liability in connection with your use of, or reliance upon, the content or products found herein.