
|
Anhui Guangxin Agrochemical Co., Ltd. (603599.Sss) DCF -Bewertung |
Fully Editable: Tailor To Your Needs In Excel Or Sheets
Professional Design: Trusted, Industry-Standard Templates
Investor-Approved Valuation Models
MAC/PC Compatible, Fully Unlocked
No Expertise Is Needed; Easy To Follow
Anhui Guangxin Agrochemical Co., Ltd. (603599.SS) Bundle
Möchten Sie den inneren Wert von Anhui Guangxin Agrochemical Co., Ltd., beurteilen? Unser DCF-Taschenrechner (603599S) integriert reale Daten mit umfangreichen Anpassungsfunktionen, sodass Sie Ihre Prognosen verfeinern und Ihre Investitionsauswahl verbessern können.
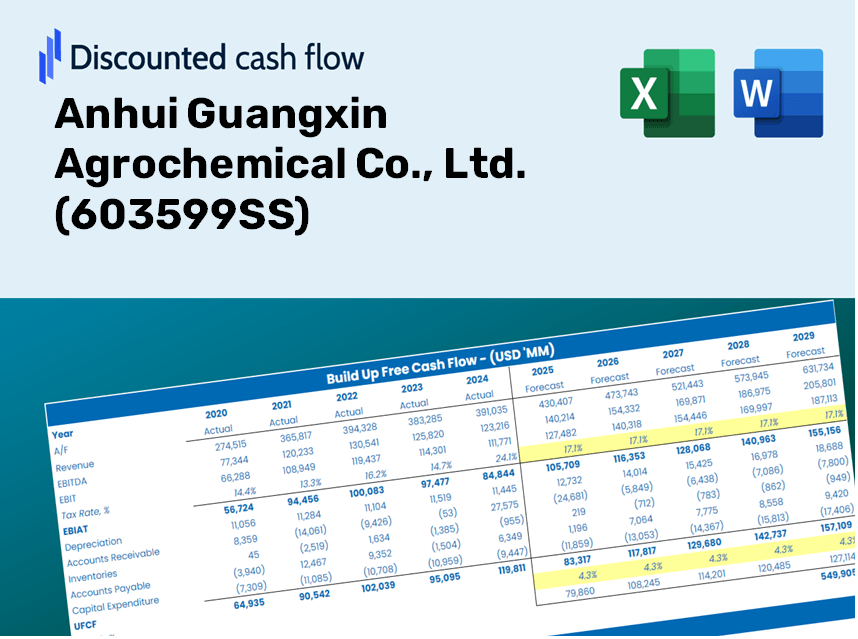
Discounted Cash Flow (DCF) - (USD MM)
| Year | AY1 2020 |
AY2 2021 |
AY3 2022 |
AY4 2023 |
AY5 2024 |
FY1 2025 |
FY2 2026 |
FY3 2027 |
FY4 2028 |
FY5 2029 |
|---|---|---|---|---|---|---|---|---|---|---|
| Revenue | 3,402.4 | 5,549.9 | 9,062.4 | 5,867.6 | 4,642.6 | 4,386.0 | 4,143.4 | 3,914.4 | 3,697.9 | 3,493.5 |
| Revenue Growth, % | 0 | 63.12 | 63.29 | -35.25 | -20.88 | -5.53 | -5.53 | -5.53 | -5.53 | -5.53 |
| EBITDA | 800.3 | 1,782.9 | 2,782.2 | 1,564.4 | 967.1 | 1,174.0 | 1,109.1 | 1,047.8 | 989.9 | 935.1 |
| EBITDA, % | 23.52 | 32.13 | 30.7 | 26.66 | 20.83 | 26.77 | 26.77 | 26.77 | 26.77 | 26.77 |
| Depreciation | 228.7 | 226.0 | 283.4 | 301.3 | 262.9 | 216.8 | 204.8 | 193.5 | 182.8 | 172.7 |
| Depreciation, % | 6.72 | 4.07 | 3.13 | 5.13 | 5.66 | 4.94 | 4.94 | 4.94 | 4.94 | 4.94 |
| EBIT | 571.6 | 1,556.9 | 2,498.8 | 1,263.1 | 704.3 | 957.2 | 904.3 | 854.3 | 807.0 | 762.4 |
| EBIT, % | 16.8 | 28.05 | 27.57 | 21.53 | 15.17 | 21.82 | 21.82 | 21.82 | 21.82 | 21.82 |
| Total Cash | 4,007.4 | 5,706.7 | 8,639.7 | 10,639.8 | 4,046.5 | 4,232.4 | 3,998.4 | 3,777.3 | 3,568.5 | 3,371.2 |
| Total Cash, percent | .0 | .0 | .0 | .0 | .0 | .0 | .0 | .0 | .0 | .0 |
| Account Receivables | 388.3 | 581.9 | 438.2 | 288.3 | 276.6 | 329.8 | 311.6 | 294.4 | 278.1 | 262.7 |
| Account Receivables, % | 11.41 | 10.49 | 4.83 | 4.91 | 5.96 | 7.52 | 7.52 | 7.52 | 7.52 | 7.52 |
| Inventories | 763.7 | 1,405.0 | 1,175.5 | 1,316.1 | 880.1 | 895.8 | 846.3 | 799.5 | 755.3 | 713.5 |
| Inventories, % | 22.45 | 25.32 | 12.97 | 22.43 | 18.96 | 20.42 | 20.42 | 20.42 | 20.42 | 20.42 |
| Accounts Payable | 947.5 | 1,701.9 | 2,651.4 | 1,254.5 | 1,458.7 | 1,233.1 | 1,164.9 | 1,100.5 | 1,039.6 | 982.2 |
| Accounts Payable, % | 27.85 | 30.67 | 29.26 | 21.38 | 31.42 | 28.11 | 28.11 | 28.11 | 28.11 | 28.11 |
| Capital Expenditure | -231.9 | -238.6 | -523.9 | -575.6 | -296.1 | -290.2 | -274.2 | -259.0 | -244.7 | -231.1 |
| Capital Expenditure, % | -6.81 | -4.3 | -5.78 | -9.81 | -6.38 | -6.62 | -6.62 | -6.62 | -6.62 | -6.62 |
| Tax Rate, % | 14.55 | 14.55 | 14.55 | 14.55 | 14.55 | 14.55 | 14.55 | 14.55 | 14.55 | 14.55 |
| EBITAT | 502.2 | 1,364.8 | 2,132.5 | 1,103.6 | 601.8 | 830.3 | 784.4 | 741.0 | 700.0 | 661.3 |
| Depreciation | ||||||||||
| Changes in Account Receivables | ||||||||||
| Changes in Inventories | ||||||||||
| Changes in Accounts Payable | ||||||||||
| Capital Expenditure | ||||||||||
| UFCF | 294.6 | 1,271.6 | 3,214.8 | -558.4 | 1,220.5 | 462.3 | 714.6 | 675.1 | 637.8 | 602.5 |
| WACC, % | 5.21 | 5.2 | 5.19 | 5.2 | 5.19 | 5.2 | 5.2 | 5.2 | 5.2 | 5.2 |
| PV UFCF | ||||||||||
| SUM PV UFCF | 2,653.6 | |||||||||
| Long Term Growth Rate, % | 0.50 | |||||||||
| Free cash flow (T + 1) | 606 | |||||||||
| Terminal Value | 12,892 | |||||||||
| Present Terminal Value | 10,007 | |||||||||
| Enterprise Value | 12,661 | |||||||||
| Net Debt | 1,621 | |||||||||
| Equity Value | 11,039 | |||||||||
| Diluted Shares Outstanding, MM | 906 | |||||||||
| Equity Value Per Share | 12.19 |
Benefits of Our Financial Model
- Comprehensive Financial Model: Utilize Anhui Guangxin Agrochemical Co., Ltd.'s (603599SS) real data for accurate DCF valuation.
- Full Control Over Forecasts: Modify revenue growth rates, profit margins, WACC, and other critical factors at your discretion.
- Real-Time Calculations: Experience instant updates that reflect your adjustments immediately.
- Professional-Grade Template: A polished Excel file crafted for high-level valuation presentations.
- Flexible and Reusable: Designed for adaptability, allowing ongoing use for in-depth forecasts.
Key Features
- Real-Time AGRO Data: Pre-populated with Anhui Guangxin Agrochemical Co., Ltd.'s historical financials and future projections.
- Comprehensive Customization Options: Modify growth rates, profit margins, discount rates, tax obligations, and capital expenditures as needed.
- Interactive Valuation Model: Instant updates to Net Present Value (NPV) and intrinsic value reflecting your specified parameters.
- Scenario Analysis: Generate multiple forecasting scenarios to explore various valuation results.
- User-Centric Interface: Intuitive and organized, catering to both industry professionals and newcomers.
How It Functions
- Step 1: Download the Excel file.
- Step 2: Review Anhui Guangxin Agrochemical Co., Ltd.'s pre-filled financial data and projections.
- Step 3: Adjust key inputs such as revenue growth, WACC, and tax rates (highlighted cells).
- Step 4: Watch the DCF model update in real-time as you modify assumptions.
- Step 5: Examine the outputs and leverage the findings for your investment strategies.
Why Choose This Calculator for Anhui Guangxin Agrochemical Co., Ltd. (603599SS)?
- User-Friendly Interface: Crafted to accommodate both novices and seasoned users.
- Customizable Variables: Effortlessly adjust inputs to suit your specific analysis.
- Real-Time Updates: Observe immediate changes in Anhui Guangxin's valuation as you tweak the inputs.
- Preloaded Data: Comes equipped with Anhui Guangxin's actual financial figures for swift assessments.
- Relied Upon by Experts: Utilized by investors and analysts to guide strategic decisions.
Who Should Benefit From This Product?
- Agriculture Students: Discover application techniques and analyze real-world agricultural data.
- Researchers: Utilize industry models for academic projects or agricultural studies.
- Investors: Validate your investment strategies and assess the market performance of Anhui Guangxin Agrochemical Co., Ltd. (603599SS).
- Market Analysts: Enhance your analysis efficiency with an adaptable, pre-designed DCF model.
- Entrepreneurs: Understand the evaluation processes used for large agrochemical firms like Anhui Guangxin Agrochemical Co., Ltd. (603599SS).
Components of the Template
- Pre-Filled DCF Model: Anhui Guangxin Agrochemical’s financial data preloaded for immediate application.
- WACC Calculator: Comprehensive calculations for the Weighted Average Cost of Capital.
- Financial Ratios: Assess Anhui Guangxin's profitability, leverage, and operational efficiency.
- Editable Inputs: Adjust assumptions such as growth rates, profit margins, and capital expenditures to tailor your scenarios.
- Financial Statements: Access annual and quarterly reports for thorough analysis.
- Interactive Dashboard: Effortlessly visualize key valuation metrics and outcomes.
Disclaimer
All information, articles, and product details provided on this website are for general informational and educational purposes only. We do not claim any ownership over, nor do we intend to infringe upon, any trademarks, copyrights, logos, brand names, or other intellectual property mentioned or depicted on this site. Such intellectual property remains the property of its respective owners, and any references here are made solely for identification or informational purposes, without implying any affiliation, endorsement, or partnership.
We make no representations or warranties, express or implied, regarding the accuracy, completeness, or suitability of any content or products presented. Nothing on this website should be construed as legal, tax, investment, financial, medical, or other professional advice. In addition, no part of this site—including articles or product references—constitutes a solicitation, recommendation, endorsement, advertisement, or offer to buy or sell any securities, franchises, or other financial instruments, particularly in jurisdictions where such activity would be unlawful.
All content is of a general nature and may not address the specific circumstances of any individual or entity. It is not a substitute for professional advice or services. Any actions you take based on the information provided here are strictly at your own risk. You accept full responsibility for any decisions or outcomes arising from your use of this website and agree to release us from any liability in connection with your use of, or reliance upon, the content or products found herein.