
|
Ningbo -Orientdrähte & Cables Co., Ltd. (603606.SS) DCF -Bewertung |
Fully Editable: Tailor To Your Needs In Excel Or Sheets
Professional Design: Trusted, Industry-Standard Templates
Investor-Approved Valuation Models
MAC/PC Compatible, Fully Unlocked
No Expertise Is Needed; Easy To Follow
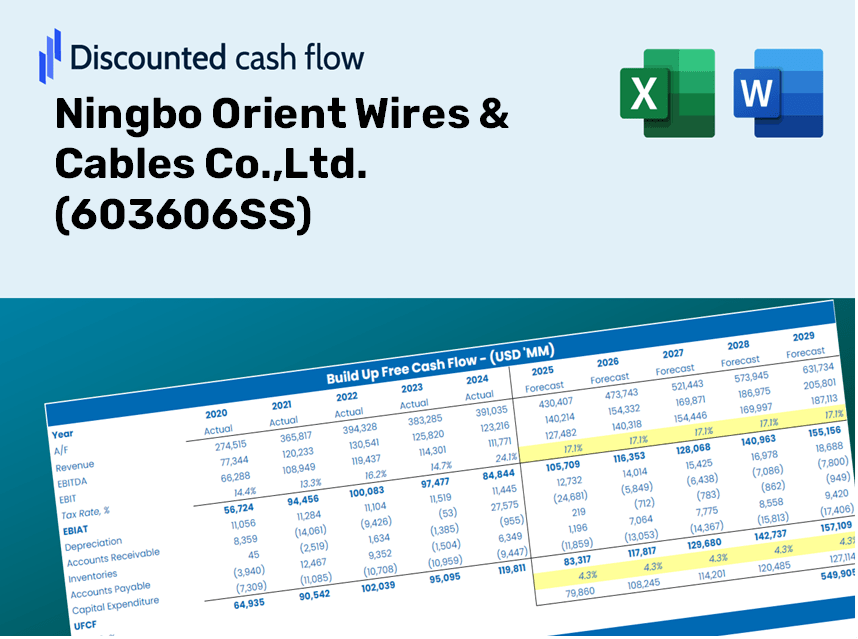
Ningbo Orient Wires & Cables Co.,Ltd. (603606.SS) Bundle
Vereinfachen Sie Ningbo -Orientdrähte & Cables Co., Ltd. (603606SS) Bewertung mit diesem anpassbaren DCF -Taschenrechner! Mit echten Ningbo -Orientdrähten & Cables Co., Ltd. (603606SS) Finanzdaten und einstellbare Prognoseeingaben können Szenarien testen und Ningbo -Orientdrähte aufdecken & Cables Co., Ltd. (603606SS) Fairer Wert in Minuten.
Discounted Cash Flow (DCF) - (USD MM)
| Year | AY1 2020 |
AY2 2021 |
AY3 2022 |
AY4 2023 |
AY5 2024 |
FY1 2025 |
FY2 2026 |
FY3 2027 |
FY4 2028 |
FY5 2029 |
|---|---|---|---|---|---|---|---|---|---|---|
| Revenue | 5,052.3 | 7,932.2 | 7,008.9 | 7,310.0 | 9,092.5 | 10,775.6 | 12,770.2 | 15,134.0 | 17,935.3 | 21,255.2 |
| Revenue Growth, % | 0 | 57 | -11.64 | 4.3 | 24.38 | 18.51 | 18.51 | 18.51 | 18.51 | 18.51 |
| EBITDA | 1,036.2 | 1,408.0 | 1,123.3 | 1,272.3 | 1,191.7 | 1,827.4 | 2,165.7 | 2,566.6 | 3,041.7 | 3,604.7 |
| EBITDA, % | 20.51 | 17.75 | 16.03 | 17.4 | 13.11 | 16.96 | 16.96 | 16.96 | 16.96 | 16.96 |
| Depreciation | 68.2 | 73.6 | 143.6 | 164.2 | 174.7 | 183.0 | 216.9 | 257.1 | 304.7 | 361.1 |
| Depreciation, % | 1.35 | 0.92829 | 2.05 | 2.25 | 1.92 | 1.7 | 1.7 | 1.7 | 1.7 | 1.7 |
| EBIT | 968.0 | 1,334.3 | 979.7 | 1,108.1 | 1,017.0 | 1,644.4 | 1,948.8 | 2,309.5 | 2,737.0 | 3,243.6 |
| EBIT, % | 19.16 | 16.82 | 13.98 | 15.16 | 11.19 | 15.26 | 15.26 | 15.26 | 15.26 | 15.26 |
| Total Cash | 1,267.4 | 1,821.5 | 2,367.8 | 2,227.7 | 2,855.3 | 3,097.1 | 3,670.4 | 4,349.8 | 5,154.9 | 6,109.1 |
| Total Cash, percent | .0 | .0 | .0 | .0 | .0 | .0 | .0 | .0 | .0 | .0 |
| Account Receivables | 2,416.9 | 2,917.5 | 2,920.2 | 3,303.6 | 3,592.4 | 4,547.0 | 5,388.6 | 6,386.1 | 7,568.2 | 8,969.1 |
| Account Receivables, % | 47.84 | 36.78 | 41.66 | 45.19 | 39.51 | 42.2 | 42.2 | 42.2 | 42.2 | 42.2 |
| Inventories | 949.6 | 1,517.7 | 1,320.8 | 2,147.7 | 1,834.4 | 2,291.5 | 2,715.7 | 3,218.3 | 3,814.1 | 4,520.1 |
| Inventories, % | 18.8 | 19.13 | 18.84 | 29.38 | 20.18 | 21.27 | 21.27 | 21.27 | 21.27 | 21.27 |
| Accounts Payable | 975.7 | 1,835.3 | 1,670.5 | 807.0 | 2,671.6 | 2,299.6 | 2,725.3 | 3,229.7 | 3,827.6 | 4,536.1 |
| Accounts Payable, % | 19.31 | 23.14 | 23.83 | 11.04 | 29.38 | 21.34 | 21.34 | 21.34 | 21.34 | 21.34 |
| Capital Expenditure | -491.2 | -708.1 | -443.8 | -662.2 | -613.1 | -878.9 | -1,041.6 | -1,234.4 | -1,462.9 | -1,733.7 |
| Capital Expenditure, % | -9.72 | -8.93 | -6.33 | -9.06 | -6.74 | -8.16 | -8.16 | -8.16 | -8.16 | -8.16 |
| Tax Rate, % | 12.22 | 12.22 | 12.22 | 12.22 | 12.22 | 12.22 | 12.22 | 12.22 | 12.22 | 12.22 |
| EBITAT | 834.9 | 1,157.6 | 858.8 | 967.4 | 892.8 | 1,433.1 | 1,698.4 | 2,012.8 | 2,385.3 | 2,826.9 |
| Depreciation | ||||||||||
| Changes in Account Receivables | ||||||||||
| Changes in Inventories | ||||||||||
| Changes in Accounts Payable | ||||||||||
| Capital Expenditure | ||||||||||
| UFCF | -1,978.9 | 314.0 | 588.0 | -1,604.4 | 2,343.3 | -1,046.4 | 33.6 | 39.8 | 47.1 | 55.9 |
| WACC, % | 4.64 | 4.65 | 4.65 | 4.65 | 4.65 | 4.65 | 4.65 | 4.65 | 4.65 | 4.65 |
| PV UFCF | ||||||||||
| SUM PV UFCF | -850.8 | |||||||||
| Long Term Growth Rate, % | 3.50 | |||||||||
| Free cash flow (T + 1) | 58 | |||||||||
| Terminal Value | 5,047 | |||||||||
| Present Terminal Value | 4,022 | |||||||||
| Enterprise Value | 3,171 | |||||||||
| Net Debt | -2,305 | |||||||||
| Equity Value | 5,476 | |||||||||
| Diluted Shares Outstanding, MM | 687 | |||||||||
| Equity Value Per Share | 7.98 |
Benefits You'll Enjoy
- Comprehensive Financial Framework: Utilize Ningbo Orient Wires & Cables Co.,Ltd.'s (603606SS) real data for accurate DCF valuations.
- Complete Forecast Customization: Modify revenue growth, profit margins, WACC, and other essential factors to suit your analysis.
- Real-Time Calculations: Enjoy automatic updates that reflect changes instantly, ensuring immediate insights.
- Professional-Grade Template: A polished Excel model crafted for high-quality valuation presentations.
- Flexible and Reusable: Designed for versatility, allowing you to efficiently conduct multiple detailed forecasts.
Key Features
- Real-Time Ningbo Orient Data: Pre-loaded with Ningbo Orient Wires & Cables' historical financials and future projections.
- Customizable Parameters: Modify revenue growth rates, profit margins, WACC, tax rates, and capital expenditures to suit your analysis.
- Interactive Valuation Model: Automatically recalculates Net Present Value (NPV) and intrinsic value based on your adjusted inputs.
- Scenario Analysis: Develop various forecasting scenarios to evaluate different valuation possibilities.
- User-Centric Interface: Clean, organized layout designed for both seasoned professionals and newcomers.
How It Works
- Step 1: Download the ready-to-use Excel template featuring data for Ningbo Orient Wires & Cables Co., Ltd. (603606SS).
- Step 2: Navigate through the pre-filled sheets to familiarize yourself with the essential metrics.
- Step 3: Adjust forecasts and assumptions in the editable yellow cells (WACC, growth, margins).
- Step 4: Instantly view updated results, including the intrinsic value of Ningbo Orient Wires & Cables Co., Ltd. (603606SS).
- Step 5: Use the outputs to make informed investment choices or create detailed reports.
Reasons to Choose Ningbo Orient Wires & Cables Co., Ltd. (603606SS)
- Dependability: Accurate metrics derived from reliable financial data.
- Customizability: Tailored for users to easily modify and explore different scenarios.
- Efficiency: Eliminate the complexity of building a model from the ground up.
- Expert-Level: Crafted with insights comparable to those of industry leaders.
- Intuitive: Simple interface designed for users of all experience levels in financial analysis.
Who Can Benefit from This Product?
- Investors: Assess the valuation of Ningbo Orient Wires & Cables Co., Ltd. (603606SS) before making stock transactions.
- CFOs and Financial Analysts: Optimize valuation methodologies and evaluate financial forecasts.
- Startup Founders: Discover how industry leaders like Ningbo Orient Wires & Cables are appraised.
- Consultants: Provide clients with detailed and professional valuation analyses.
- Students and Educators: Utilize current market data to practice and teach valuation strategies.
Contents of the Template
- Pre-Populated Data: Features Ningbo Orient Wires & Cables Co., Ltd.'s historical financials and projections.
- Discounted Cash Flow Model: An editable DCF valuation model with automatic calculations included.
- Weighted Average Cost of Capital (WACC): A separate sheet dedicated to calculating WACC using custom inputs.
- Essential Financial Ratios: Evaluate Ningbo Orient's profitability, efficiency, and leverage metrics.
- Customizable Inputs: Easily adjust revenue growth, profit margins, and tax rates.
- User-Friendly Dashboard: Visual representations and tables that summarize critical valuation outcomes.
Disclaimer
All information, articles, and product details provided on this website are for general informational and educational purposes only. We do not claim any ownership over, nor do we intend to infringe upon, any trademarks, copyrights, logos, brand names, or other intellectual property mentioned or depicted on this site. Such intellectual property remains the property of its respective owners, and any references here are made solely for identification or informational purposes, without implying any affiliation, endorsement, or partnership.
We make no representations or warranties, express or implied, regarding the accuracy, completeness, or suitability of any content or products presented. Nothing on this website should be construed as legal, tax, investment, financial, medical, or other professional advice. In addition, no part of this site—including articles or product references—constitutes a solicitation, recommendation, endorsement, advertisement, or offer to buy or sell any securities, franchises, or other financial instruments, particularly in jurisdictions where such activity would be unlawful.
All content is of a general nature and may not address the specific circumstances of any individual or entity. It is not a substitute for professional advice or services. Any actions you take based on the information provided here are strictly at your own risk. You accept full responsibility for any decisions or outcomes arising from your use of this website and agree to release us from any liability in connection with your use of, or reliance upon, the content or products found herein.