
|
Wellhope Foods Co., Ltd. (603609.Sss) DCF -Bewertung |
Fully Editable: Tailor To Your Needs In Excel Or Sheets
Professional Design: Trusted, Industry-Standard Templates
Investor-Approved Valuation Models
MAC/PC Compatible, Fully Unlocked
No Expertise Is Needed; Easy To Follow
Wellhope Foods Co., Ltd. (603609.SS) Bundle
Bewerten Sie Wellhope Foods Co., Ltd. (603609S) Finanzaussichten wie ein Experte! Dieser (603609SS) DCF-Taschenrechner liefert vorgefüllte Finanzdaten und bietet gleichzeitig die Flexibilität, das Umsatzwachstum, WACC, Margen und andere kritische Annahmen zu ändern, um sich mit Ihren Vorhersagen auszurichten.
Discounted Cash Flow (DCF) - (USD MM)
| Year | AY1 2020 |
AY2 2021 |
AY3 2022 |
AY4 2023 |
AY5 2024 |
FY1 2025 |
FY2 2026 |
FY3 2027 |
FY4 2028 |
FY5 2029 |
|---|---|---|---|---|---|---|---|---|---|---|
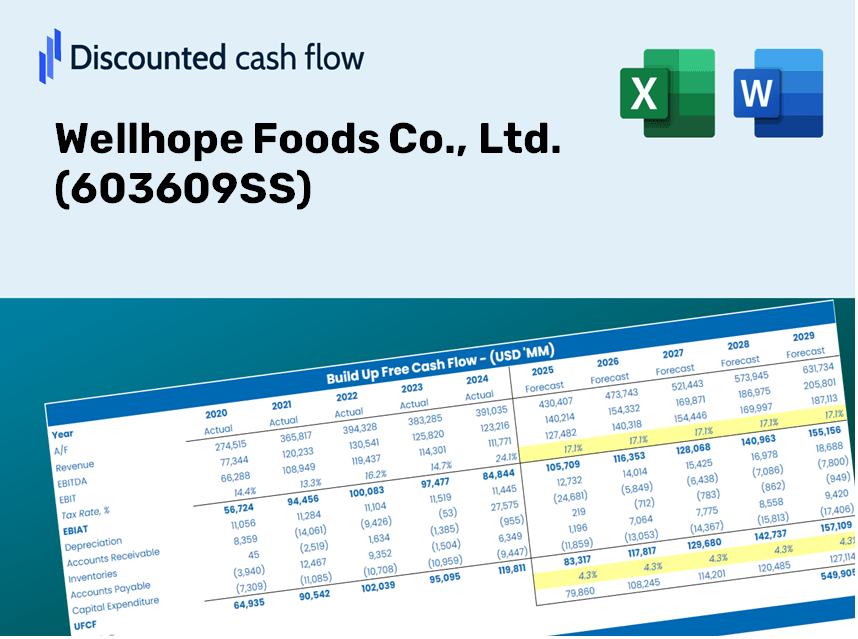
| Revenue | 23,817.6 | 29,468.9 | 32,811.8 | 35,970.3 | 32,545.3 | 35,407.2 | 38,520.9 | 41,908.4 | 45,593.8 | 49,603.2 |
| Revenue Growth, % | 0 | 23.73 | 11.34 | 9.63 | -9.52 | 8.79 | 8.79 | 8.79 | 8.79 | 8.79 |
| EBITDA | 1,479.4 | 784.3 | 1,070.0 | 257.5 | 1,027.0 | 1,133.4 | 1,233.1 | 1,341.5 | 1,459.5 | 1,587.8 |
| EBITDA, % | 6.21 | 2.66 | 3.26 | 0.71596 | 3.16 | 3.2 | 3.2 | 3.2 | 3.2 | 3.2 |
| Depreciation | 291.6 | 402.5 | 446.3 | 471.2 | 539.1 | 489.8 | 532.9 | 579.7 | 630.7 | 686.2 |
| Depreciation, % | 1.22 | 1.37 | 1.36 | 1.31 | 1.66 | 1.38 | 1.38 | 1.38 | 1.38 | 1.38 |
| EBIT | 1,187.8 | 381.8 | 623.7 | -213.7 | 487.9 | 643.6 | 700.2 | 761.8 | 828.8 | 901.6 |
| EBIT, % | 4.99 | 1.3 | 1.9 | -0.5941 | 1.5 | 1.82 | 1.82 | 1.82 | 1.82 | 1.82 |
| Total Cash | 1,247.7 | 1,233.6 | 1,688.7 | 1,916.2 | 1,795.1 | 1,799.7 | 1,958.0 | 2,130.2 | 2,317.5 | 2,521.3 |
| Total Cash, percent | .0 | .0 | .0 | .0 | .0 | .0 | .0 | .0 | .0 | .0 |
| Account Receivables | 468.7 | 695.9 | 1,139.8 | 1,216.3 | 1,000.1 | 1,009.6 | 1,098.4 | 1,195.0 | 1,300.1 | 1,414.4 |
| Account Receivables, % | 1.97 | 2.36 | 3.47 | 3.38 | 3.07 | 2.85 | 2.85 | 2.85 | 2.85 | 2.85 |
| Inventories | 2,473.8 | 2,691.2 | 3,361.6 | 2,686.8 | 2,809.0 | 3,247.9 | 3,533.5 | 3,844.2 | 4,182.3 | 4,550.1 |
| Inventories, % | 10.39 | 9.13 | 10.24 | 7.47 | 8.63 | 9.17 | 9.17 | 9.17 | 9.17 | 9.17 |
| Accounts Payable | 1,073.0 | 1,300.1 | 1,692.3 | 1,629.8 | 1,629.6 | 1,672.1 | 1,819.1 | 1,979.1 | 2,153.1 | 2,342.5 |
| Accounts Payable, % | 4.5 | 4.41 | 5.16 | 4.53 | 5.01 | 4.72 | 4.72 | 4.72 | 4.72 | 4.72 |
| Capital Expenditure | -1,400.5 | -1,184.9 | -842.8 | -486.9 | -393.1 | -1,064.4 | -1,158.0 | -1,259.8 | -1,370.6 | -1,491.2 |
| Capital Expenditure, % | -5.88 | -4.02 | -2.57 | -1.35 | -1.21 | -3.01 | -3.01 | -3.01 | -3.01 | -3.01 |
| Tax Rate, % | 13.06 | 13.06 | 13.06 | 13.06 | 13.06 | 13.06 | 13.06 | 13.06 | 13.06 | 13.06 |
| EBITAT | 972.1 | 257.0 | 509.0 | -203.1 | 424.2 | 531.3 | 578.0 | 628.8 | 684.1 | 744.3 |
| Depreciation | ||||||||||
| Changes in Account Receivables | ||||||||||
| Changes in Inventories | ||||||||||
| Changes in Accounts Payable | ||||||||||
| Capital Expenditure | ||||||||||
| UFCF | -2,006.3 | -742.9 | -609.6 | 317.1 | 663.8 | -449.2 | -274.5 | -298.6 | -324.9 | -353.5 |
| WACC, % | 5.31 | 5.06 | 5.3 | 5.53 | 5.4 | 5.32 | 5.32 | 5.32 | 5.32 | 5.32 |
| PV UFCF | ||||||||||
| SUM PV UFCF | -1,466.3 | |||||||||
| Long Term Growth Rate, % | 3.50 | |||||||||
| Free cash flow (T + 1) | -366 | |||||||||
| Terminal Value | -20,091 | |||||||||
| Present Terminal Value | -15,503 | |||||||||
| Enterprise Value | -16,970 | |||||||||
| Net Debt | 1,987 | |||||||||
| Equity Value | -18,957 | |||||||||
| Diluted Shares Outstanding, MM | 901 | |||||||||
| Equity Value Per Share | -21.03 |
What You Will Receive
- Adjustable Forecast Inputs: Effortlessly modify key assumptions (growth %, margins, WACC) to explore various scenarios.
- Comprehensive Data: Wellhope Foods Co., Ltd.'s (603609SS) financial information pre-loaded to enhance your analysis.
- Automated DCF Outputs: The model calculates Net Present Value (NPV) and intrinsic value on your behalf.
- Tailored and Professional: A sophisticated Excel model designed to meet your valuation requirements.
- Designed for Analysts and Investors: Perfect for evaluating projections, confirming strategies, and increasing efficiency.
Key Features
- Comprehensive DCF Calculator: Features in-depth unlevered and levered DCF valuation models tailored for Wellhope Foods Co., Ltd. (603609SS).
- WACC Calculator: Comes with a pre-configured Weighted Average Cost of Capital template that allows for customizable inputs.
- Adjustable Forecast Assumptions: Easily modify growth rates, capital expenditures, and discount rates as needed.
- Integrated Financial Ratios: Evaluate profitability, leverage, and efficiency ratios specifically for Wellhope Foods Co., Ltd. (603609SS).
- User-Friendly Dashboard and Charts: Visual representations provide a clear summary of essential valuation metrics for simplified analysis.
How It Works
- Step 1: Download the Excel file.
- Step 2: Examine the pre-filled Wellhope Foods data (historical and projected).
- Step 3: Modify key assumptions (highlighted in yellow) according to your analysis.
- Step 4: Observe the automatic recalculations for Wellhope Foods' intrinsic value.
- Step 5: Utilize the results for your investment decisions or reporting needs.
Why Choose This Calculator for Wellhope Foods Co., Ltd. (603609SS)?
- All-in-One Solution: Offers DCF, WACC, and financial ratio analyses all conveniently bundled together.
- Flexible Inputs: Modify the yellow-highlighted fields to explore different financial scenarios.
- In-Depth Analysis: Automatically computes the intrinsic value and Net Present Value for Wellhope Foods.
- Loaded with Data: Historical and projected figures provide reliable starting points for analysis.
- Designed for Professionals: Perfect for financial analysts, investors, and business strategists.
Who Can Benefit from This Product?
- Individual Investors: Make educated decisions regarding the purchase or sale of Wellhope Foods Co., Ltd. (603609SS) stock.
- Financial Analysts: Enhance valuation efforts with comprehensive financial models tailored for Wellhope Foods Co., Ltd. (603609SS).
- Consultants: Provide clients with precise and timely valuation insights related to Wellhope Foods Co., Ltd. (603609SS).
- Business Owners: Gain insights into how large companies like Wellhope Foods Co., Ltd. (603609SS) are valued to inform your business strategy.
- Finance Students: Explore valuation methods using real data and scenarios from Wellhope Foods Co., Ltd. (603609SS).
Components of the Template
- Thorough DCF Model: Editable template featuring intricate valuation calculations.
- Real-World Data: Wellhope Foods’ historical and projected financials preloaded for your analysis.
- Customizable Parameters: Modify WACC, growth rates, and tax assumptions to explore various scenarios.
- Financial Statements: Complete annual and quarterly breakdowns for enhanced insights.
- Key Ratios: Integrated analysis tools for evaluating profitability, efficiency, and leverage.
- Dashboard with Visual Outputs: Graphs and tables presenting clear, actionable insights.
Disclaimer
All information, articles, and product details provided on this website are for general informational and educational purposes only. We do not claim any ownership over, nor do we intend to infringe upon, any trademarks, copyrights, logos, brand names, or other intellectual property mentioned or depicted on this site. Such intellectual property remains the property of its respective owners, and any references here are made solely for identification or informational purposes, without implying any affiliation, endorsement, or partnership.
We make no representations or warranties, express or implied, regarding the accuracy, completeness, or suitability of any content or products presented. Nothing on this website should be construed as legal, tax, investment, financial, medical, or other professional advice. In addition, no part of this site—including articles or product references—constitutes a solicitation, recommendation, endorsement, advertisement, or offer to buy or sell any securities, franchises, or other financial instruments, particularly in jurisdictions where such activity would be unlawful.
All content is of a general nature and may not address the specific circumstances of any individual or entity. It is not a substitute for professional advice or services. Any actions you take based on the information provided here are strictly at your own risk. You accept full responsibility for any decisions or outcomes arising from your use of this website and agree to release us from any liability in connection with your use of, or reliance upon, the content or products found herein.