
|
Red Avenue New Materials Group Co., Ltd. (603650.SS) DCF -Bewertung |
Fully Editable: Tailor To Your Needs In Excel Or Sheets
Professional Design: Trusted, Industry-Standard Templates
Investor-Approved Valuation Models
MAC/PC Compatible, Fully Unlocked
No Expertise Is Needed; Easy To Follow
Red Avenue New Materials Group Co., Ltd. (603650.SS) Bundle
Evaluieren Sie die Finanzaussichten von Red Avenue New Materials Group Co., Ltd. (603650SS) wie ein Experte! Dieser (603650SS) DCF-Taschenrechner verfügt über vorgefüllte Finanzdaten und bietet vollständige Flexibilität, um das Umsatzwachstum, WACC, Margen und andere wesentliche Annahmen zu ändern, um sich an Ihren Prognosen auszurichten.
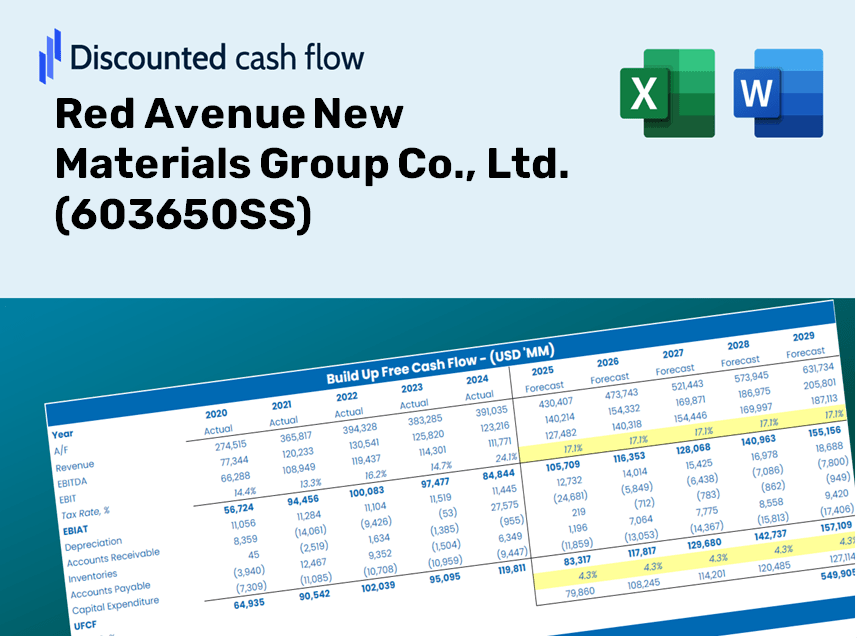
Discounted Cash Flow (DCF) - (USD MM)
| Year | AY1 2020 |
AY2 2021 |
AY3 2022 |
AY4 2023 |
AY5 2024 |
FY1 2025 |
FY2 2026 |
FY3 2027 |
FY4 2028 |
FY5 2029 |
|---|---|---|---|---|---|---|---|---|---|---|
| Revenue | 2,045.9 | 2,308.4 | 2,500.1 | 2,943.5 | 3,270.3 | 3,678.8 | 4,138.4 | 4,655.5 | 5,237.1 | 5,891.4 |
| Revenue Growth, % | 0 | 12.83 | 8.3 | 17.74 | 11.1 | 12.49 | 12.49 | 12.49 | 12.49 | 12.49 |
| EBITDA | 579.8 | 376.8 | 419.7 | 658.3 | 445.3 | 716.9 | 806.4 | 907.2 | 1,020.5 | 1,148.0 |
| EBITDA, % | 28.34 | 16.32 | 16.79 | 22.36 | 13.62 | 19.49 | 19.49 | 19.49 | 19.49 | 19.49 |
| Depreciation | 61.8 | 99.6 | 132.3 | 150.1 | 148.8 | 163.9 | 184.4 | 207.4 | 233.4 | 262.5 |
| Depreciation, % | 3.02 | 4.32 | 5.29 | 5.1 | 4.55 | 4.46 | 4.46 | 4.46 | 4.46 | 4.46 |
| EBIT | 518.0 | 277.2 | 287.4 | 508.1 | 296.6 | 553.0 | 622.0 | 699.7 | 787.2 | 885.5 |
| EBIT, % | 25.32 | 12.01 | 11.49 | 17.26 | 9.07 | 15.03 | 15.03 | 15.03 | 15.03 | 15.03 |
| Total Cash | 735.8 | 807.8 | 723.2 | 887.7 | 1,173.8 | 1,220.9 | 1,373.4 | 1,545.0 | 1,738.0 | 1,955.2 |
| Total Cash, percent | .0 | .0 | .0 | .0 | .0 | .0 | .0 | .0 | .0 | .0 |
| Account Receivables | 923.7 | 975.3 | 1,094.2 | 1,108.9 | 1,226.9 | 1,518.3 | 1,708.0 | 1,921.4 | 2,161.4 | 2,431.4 |
| Account Receivables, % | 45.15 | 42.25 | 43.77 | 37.67 | 37.52 | 41.27 | 41.27 | 41.27 | 41.27 | 41.27 |
| Inventories | 192.2 | 214.5 | 387.8 | 430.7 | 486.2 | 468.7 | 527.2 | 593.1 | 667.2 | 750.5 |
| Inventories, % | 9.39 | 9.29 | 15.51 | 14.63 | 14.87 | 12.74 | 12.74 | 12.74 | 12.74 | 12.74 |
| Accounts Payable | 386.8 | 719.9 | 766.2 | 652.5 | 528.6 | 876.1 | 985.5 | 1,108.7 | 1,247.2 | 1,403.0 |
| Accounts Payable, % | 18.91 | 31.19 | 30.65 | 22.17 | 16.16 | 23.81 | 23.81 | 23.81 | 23.81 | 23.81 |
| Capital Expenditure | -113.0 | -698.3 | -362.7 | -170.2 | -255.7 | -470.0 | -528.8 | -594.8 | -669.1 | -752.7 |
| Capital Expenditure, % | -5.52 | -30.25 | -14.51 | -5.78 | -7.82 | -12.78 | -12.78 | -12.78 | -12.78 | -12.78 |
| Tax Rate, % | 6.07 | 6.07 | 6.07 | 6.07 | 6.07 | 6.07 | 6.07 | 6.07 | 6.07 | 6.07 |
| EBITAT | 455.2 | 270.4 | 280.3 | 483.9 | 278.6 | 522.1 | 587.4 | 660.7 | 743.3 | 836.1 |
| Depreciation | ||||||||||
| Changes in Account Receivables | ||||||||||
| Changes in Inventories | ||||||||||
| Changes in Accounts Payable | ||||||||||
| Capital Expenditure | ||||||||||
| UFCF | -324.9 | -69.2 | -196.0 | 292.4 | -125.8 | 289.7 | 104.2 | 117.2 | 131.9 | 148.4 |
| WACC, % | 4.53 | 4.56 | 4.56 | 4.56 | 4.55 | 4.55 | 4.55 | 4.55 | 4.55 | 4.55 |
| PV UFCF | ||||||||||
| SUM PV UFCF | 704.1 | |||||||||
| Long Term Growth Rate, % | 4.00 | |||||||||
| Free cash flow (T + 1) | 154 | |||||||||
| Terminal Value | 27,867 | |||||||||
| Present Terminal Value | 22,305 | |||||||||
| Enterprise Value | 23,009 | |||||||||
| Net Debt | 1,617 | |||||||||
| Equity Value | 21,392 | |||||||||
| Diluted Shares Outstanding, MM | 596 | |||||||||
| Equity Value Per Share | 35.89 |
What You Will Receive
- Genuine Red Avenue Data: Preloaded financial details – from revenue to EBIT – based on actual and forecasted figures.
- Complete Customization: Modify all essential parameters (yellow cells) such as WACC, growth %, and tax rates.
- Immediate Valuation Updates: Automatic recalculations to assess the influence of changes on Red Avenue’s fair value.
- Flexible Excel Template: Designed for quick modifications, scenario analysis, and comprehensive projections.
- Efficient and Precise: Avoid building models from scratch while ensuring accuracy and adaptability.
Key Features
- Advanced DCF Calculator: Offers comprehensive unlevered and levered DCF valuation models tailored for Red Avenue New Materials Group Co., Ltd. (603650SS).
- WACC Calculator: Comes with a pre-built Weighted Average Cost of Capital sheet that allows for customizable inputs specific to the company.
- Editable Forecast Assumptions: Adjust growth rates, capital expenditures, and discount rates based on your analysis of Red Avenue New Materials Group Co., Ltd. (603650SS).
- Built-In Financial Ratios: Evaluate profitability, leverage, and efficiency ratios relevant to Red Avenue New Materials Group Co., Ltd. (603650SS).
- Dashboard and Charts: Visual representations that summarize key valuation metrics, facilitating straightforward analysis.
How It Works
- Step 1: Download the Excel file for Red Avenue New Materials Group Co., Ltd. (603650SS).
- Step 2: Review the pre-filled financial data and forecasts for Red Avenue.
- Step 3: Adjust key inputs such as revenue growth, WACC, and tax rates (highlighted cells).
- Step 4: Observe the DCF model refreshing in real-time as you modify the assumptions.
- Step 5: Evaluate the results and leverage the findings for your investment strategies.
Why Choose This Calculator for Red Avenue New Materials Group Co., Ltd. (603650SS)?
- Designed for Experts: A sophisticated tool favored by industry analysts, CFOs, and consultants.
- Accurate Data: Historical and projected financials for Red Avenue preloaded for precision.
- Flexible Scenario Analysis: Effortlessly simulate various forecasts and assumptions.
- Comprehensive Outputs: Automatically computes intrinsic value, NPV, and essential metrics.
- User-Friendly: Step-by-step guidance ensures a seamless experience.
Who Should Consider This Product?
- Investors: Evaluate Red Avenue New Materials Group Co., Ltd. (603650SS) to make informed buying or selling decisions.
- CFOs and Financial Analysts: Enhance valuation methodologies and analyze projections effectively.
- Startup Founders: Understand the valuation strategies of established companies like Red Avenue.
- Consultants: Provide comprehensive valuation reports tailored for clients in the materials sector.
- Students and Educators: Utilize authentic data to practice and teach valuation principles.
Contents of the Template
- Operating and Balance Sheet Data: Pre-filled historical data and forecasts for Red Avenue New Materials Group Co., Ltd. (603650SS), including revenue, EBITDA, EBIT, and capital expenditures.
- WACC Calculation: A dedicated sheet for the Weighted Average Cost of Capital (WACC), featuring parameters such as Beta, risk-free rate, and share price.
- DCF Valuation (Unlevered and Levered): Customizable Discounted Cash Flow models that present intrinsic value along with detailed calculations.
- Financial Statements: Pre-loaded financial statements (annual and quarterly) to facilitate analysis.
- Key Ratios: Includes profitability, leverage, and efficiency ratios for Red Avenue New Materials Group Co., Ltd. (603650SS).
- Dashboard and Charts: Visual overview of valuation outputs and assumptions for easy analysis of results.
Disclaimer
All information, articles, and product details provided on this website are for general informational and educational purposes only. We do not claim any ownership over, nor do we intend to infringe upon, any trademarks, copyrights, logos, brand names, or other intellectual property mentioned or depicted on this site. Such intellectual property remains the property of its respective owners, and any references here are made solely for identification or informational purposes, without implying any affiliation, endorsement, or partnership.
We make no representations or warranties, express or implied, regarding the accuracy, completeness, or suitability of any content or products presented. Nothing on this website should be construed as legal, tax, investment, financial, medical, or other professional advice. In addition, no part of this site—including articles or product references—constitutes a solicitation, recommendation, endorsement, advertisement, or offer to buy or sell any securities, franchises, or other financial instruments, particularly in jurisdictions where such activity would be unlawful.
All content is of a general nature and may not address the specific circumstances of any individual or entity. It is not a substitute for professional advice or services. Any actions you take based on the information provided here are strictly at your own risk. You accept full responsibility for any decisions or outcomes arising from your use of this website and agree to release us from any liability in connection with your use of, or reliance upon, the content or products found herein.