
|
Fujian Tianma Science and Technology Group Co., Ltd (603668.SS) DCF -Bewertung |
Fully Editable: Tailor To Your Needs In Excel Or Sheets
Professional Design: Trusted, Industry-Standard Templates
Investor-Approved Valuation Models
MAC/PC Compatible, Fully Unlocked
No Expertise Is Needed; Easy To Follow
Fujian Tianma Science and Technology Group Co., Ltd (603668.SS) Bundle
Möchten Sie den inneren Wert von Fujian Tianma Science and Technology Group Co., Ltd. beurteilen? Unser DCF-Taschenrechner (603668S) integriert reale Daten mit umfassenden Anpassungsfunktionen, sodass Sie Prognosen anpassen und Ihre Anlagestrategien verbessern können.
What You Will Receive
- Customizable Excel Template: A fully adjustable Excel-based DCF Calculator featuring pre-filled financial data for Fujian Tianma Science and Technology Group Co., Ltd (603668SS).
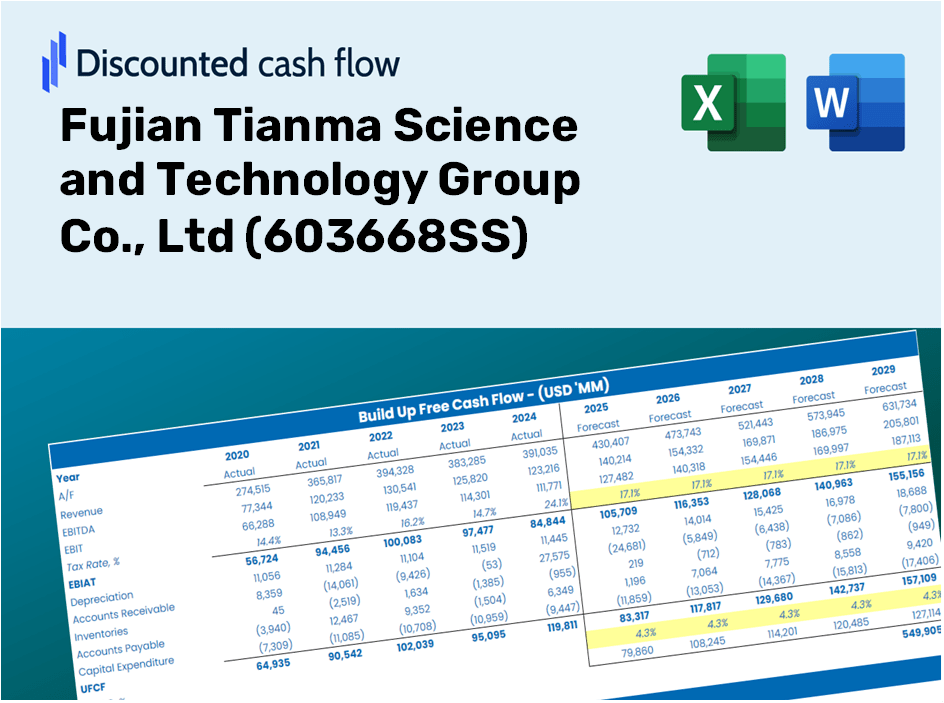
- Real-World Insights: Access to historical data and forward-looking projections (highlighted in the yellow cells).
- Flexible Forecasting: Modify forecast variables such as revenue growth, EBITDA percentage, and WACC as needed.
- Instant Calculations: Quickly observe how your inputs affect the valuation of Fujian Tianma Science and Technology Group Co., Ltd (603668SS).
- Professional Resource: Tailored for investors, CFOs, consultants, and financial analysts.
- User-Centric Layout: Designed for simplicity and clarity, complete with comprehensive step-by-step instructions.
Key Features
- Comprehensive Data Set: Fujian Tianma's historical financial reports and ready-to-use forecasts.
- Customizable Parameters: Adjust WACC, tax rates, revenue growth, and EBITDA margins to suit your analysis.
- Real-Time Calculations: View the intrinsic value of Fujian Tianma (603668SS) update instantly with your inputs.
- Intuitive Visualizations: Dashboard graphs present valuation outcomes and essential metrics clearly.
- Designed for Precision: A robust tool tailored for analysts, investors, and finance professionals.
How It Works
- Step 1: Download the Excel file.
- Step 2: Review pre-filled Fujian Tianma data (historical and projected).
- Step 3: Modify key assumptions (yellow cells) according to your analysis.
- Step 4: Observe automatic recalculations for Fujian Tianma’s intrinsic value.
- Step 5: Leverage the outputs for investment decisions or reporting.
Why Opt for This Calculator for Fujian Tianma Science and Technology Group Co., Ltd (603668SS)?
- Precision: Utilizes authentic financial data from Fujian Tianma for enhanced accuracy.
- Adaptability: Built to allow users to effortlessly test and modify inputs.
- Efficiency: Eliminate the need to construct a DCF model from the ground up.
- High-Quality: Crafted with the expertise and usability expected by CFOs.
- Intuitive: Designed for ease of use, catering to both experts and newcomers in financial modeling.
Who Can Benefit from Fujian Tianma Science and Technology Group Co., Ltd (603668SS)?
- Investors: Make informed investment choices with our comprehensive solutions tailored for your needs.
- Financial Analysts: Streamline your analysis process with our customizable financial models and tools.
- Consultants: Effortlessly modify our resources for effective client presentations and detailed reports.
- Finance Enthusiasts: Expand your knowledge of advanced financial techniques through practical applications and case studies.
- Educators and Students: Utilize our offerings as essential learning materials in finance and technology courses.
Contents of the Template
- Comprehensive DCF Model: An editable template featuring in-depth valuation calculations.
- Real-World Data: Historical and projected financial data for Fujian Tianma Science and Technology Group Co., Ltd (603668SS) preloaded for analysis.
- Customizable Parameters: Modify WACC, growth rates, and tax assumptions to explore different scenarios.
- Financial Statements: Complete annual and quarterly financial breakdowns for enhanced insights.
- Key Ratios: Integrated analysis for profitability, efficiency, and leverage metrics.
- Dashboard with Visual Outputs: Visualizations and tables providing clear, actionable results.
Disclaimer
All information, articles, and product details provided on this website are for general informational and educational purposes only. We do not claim any ownership over, nor do we intend to infringe upon, any trademarks, copyrights, logos, brand names, or other intellectual property mentioned or depicted on this site. Such intellectual property remains the property of its respective owners, and any references here are made solely for identification or informational purposes, without implying any affiliation, endorsement, or partnership.
We make no representations or warranties, express or implied, regarding the accuracy, completeness, or suitability of any content or products presented. Nothing on this website should be construed as legal, tax, investment, financial, medical, or other professional advice. In addition, no part of this site—including articles or product references—constitutes a solicitation, recommendation, endorsement, advertisement, or offer to buy or sell any securities, franchises, or other financial instruments, particularly in jurisdictions where such activity would be unlawful.
All content is of a general nature and may not address the specific circumstances of any individual or entity. It is not a substitute for professional advice or services. Any actions you take based on the information provided here are strictly at your own risk. You accept full responsibility for any decisions or outcomes arising from your use of this website and agree to release us from any liability in connection with your use of, or reliance upon, the content or products found herein.