
|
Jiangsu New Energy Development Co., Ltd. (603693.SS) DCF -Bewertung |
Fully Editable: Tailor To Your Needs In Excel Or Sheets
Professional Design: Trusted, Industry-Standard Templates
Investor-Approved Valuation Models
MAC/PC Compatible, Fully Unlocked
No Expertise Is Needed; Easy To Follow
Jiangsu New Energy Development Co., Ltd. (603693.SS) Bundle
Als Investor oder Analyst ist der DCF-Rechner von Jiangsu New Energy Development Co., Ltd. (603693S) Ihr Anlaufwerk für eine genaue Bewertung. Mit realen Daten von Jiangsu New Energy Development Co., Ltd. können Sie Prognosen anpassen und die Auswirkungen sofort beobachten.
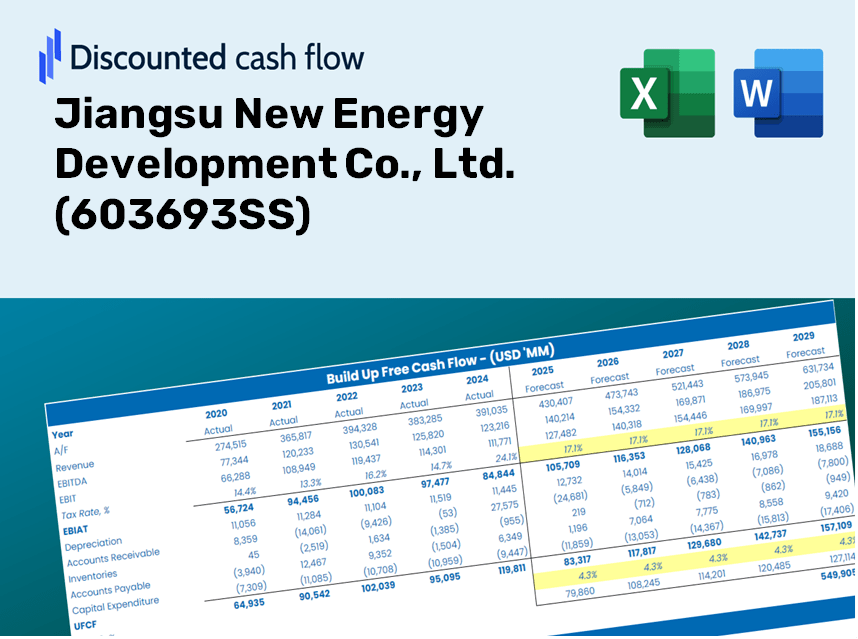
Discounted Cash Flow (DCF) - (USD MM)
| Year | AY1 2020 |
AY2 2021 |
AY3 2022 |
AY4 2023 |
AY5 2024 |
FY1 2025 |
FY2 2026 |
FY3 2027 |
FY4 2028 |
FY5 2029 |
|---|---|---|---|---|---|---|---|---|---|---|
| Revenue | 1,546.7 | 1,858.9 | 1,971.1 | 1,945.8 | 2,099.1 | 2,271.3 | 2,457.6 | 2,659.2 | 2,877.3 | 3,113.4 |
| Revenue Growth, % | 0 | 20.18 | 6.03 | -1.28 | 7.88 | 8.2 | 8.2 | 8.2 | 8.2 | 8.2 |
| EBITDA | 993.9 | 1,196.0 | 1,501.6 | 1,435.4 | 1,406.7 | 1,569.7 | 1,698.5 | 1,837.8 | 1,988.6 | 2,151.7 |
| EBITDA, % | 64.26 | 64.34 | 76.18 | 73.77 | 67.01 | 69.11 | 69.11 | 69.11 | 69.11 | 69.11 |
| Depreciation | 375.5 | 389.8 | 634.9 | 646.0 | 671.4 | 648.0 | 701.1 | 758.6 | 820.9 | 888.2 |
| Depreciation, % | 24.28 | 20.97 | 32.21 | 33.2 | 31.99 | 28.53 | 28.53 | 28.53 | 28.53 | 28.53 |
| EBIT | 618.4 | 806.2 | 866.7 | 789.4 | 735.3 | 921.8 | 997.4 | 1,079.2 | 1,167.7 | 1,263.5 |
| EBIT, % | 39.98 | 43.37 | 43.97 | 40.57 | 35.03 | 40.58 | 40.58 | 40.58 | 40.58 | 40.58 |
| Total Cash | 1,227.2 | 1,136.5 | 1,437.2 | 1,291.6 | 1,762.4 | 1,652.3 | 1,787.8 | 1,934.5 | 2,093.2 | 2,264.9 |
| Total Cash, percent | .0 | .0 | .0 | .0 | .0 | .0 | .0 | .0 | .0 | .0 |
| Account Receivables | 1,361.3 | 1,893.5 | 2,081.1 | 3,040.7 | 3,575.4 | 2,216.8 | 2,398.7 | 2,595.4 | 2,808.4 | 3,038.7 |
| Account Receivables, % | 88.01 | 101.86 | 105.58 | 156.26 | 170.33 | 97.6 | 97.6 | 97.6 | 97.6 | 97.6 |
| Inventories | 32.7 | 19.5 | 17.0 | 20.5 | 18.8 | 27.1 | 29.4 | 31.8 | 34.4 | 37.2 |
| Inventories, % | 2.11 | 1.05 | 0.86178 | 1.06 | 0.89548 | 1.19 | 1.19 | 1.19 | 1.19 | 1.19 |
| Accounts Payable | 30.9 | 2,097.8 | 1,493.9 | 1,281.2 | 1,003.1 | 1,323.8 | 1,432.4 | 1,549.9 | 1,677.0 | 1,814.6 |
| Accounts Payable, % | 2 | 112.85 | 75.79 | 65.84 | 47.79 | 58.28 | 58.28 | 58.28 | 58.28 | 58.28 |
| Capital Expenditure | -1,609.2 | -1,643.8 | -610.3 | -815.0 | -877.4 | -1,376.7 | -1,489.7 | -1,611.9 | -1,744.1 | -1,887.1 |
| Capital Expenditure, % | -104.04 | -88.43 | -30.96 | -41.88 | -41.8 | -60.61 | -60.61 | -60.61 | -60.61 | -60.61 |
| Tax Rate, % | 34.88 | 34.88 | 34.88 | 34.88 | 34.88 | 34.88 | 34.88 | 34.88 | 34.88 | 34.88 |
| EBITAT | 426.1 | 539.1 | 593.5 | 561.9 | 478.8 | 627.8 | 679.3 | 735.0 | 795.3 | 860.6 |
| Depreciation | ||||||||||
| Changes in Account Receivables | ||||||||||
| Changes in Inventories | ||||||||||
| Changes in Accounts Payable | ||||||||||
| Capital Expenditure | ||||||||||
| UFCF | -2,170.7 | 833.0 | -170.8 | -782.9 | -538.3 | 1,570.0 | -184.7 | -199.9 | -216.2 | -234.0 |
| WACC, % | 4.19 | 4.16 | 4.18 | 4.22 | 4.13 | 4.18 | 4.18 | 4.18 | 4.18 | 4.18 |
| PV UFCF | ||||||||||
| SUM PV UFCF | 785.8 | |||||||||
| Long Term Growth Rate, % | 3.50 | |||||||||
| Free cash flow (T + 1) | -242 | |||||||||
| Terminal Value | -35,732 | |||||||||
| Present Terminal Value | -29,119 | |||||||||
| Enterprise Value | -28,333 | |||||||||
| Net Debt | 3,998 | |||||||||
| Equity Value | -32,331 | |||||||||
| Diluted Shares Outstanding, MM | 891 | |||||||||
| Equity Value Per Share | -36.27 |
What You Will Receive
- Genuine JNED Financials: Access to both historical and projected data for precise evaluations.
- Customizable Inputs: Adjust WACC, tax rates, revenue growth, and capital expenditures as needed.
- Automatic Computations: Intrinsic value and NPV are calculated in real-time.
- Scenario Analysis: Explore various scenarios to assess Jiangsu New Energy's future performance.
- User-Friendly Design: Designed for professionals while remaining accessible to novices.
Key Features
- Real-Time 603693SS Data: Comes with Jiangsu New Energy Development's historical financial data and forward-looking forecasts.
- Comprehensive Input Customization: Modify parameters such as revenue growth, profit margins, WACC, tax rates, and capital expenditures.
- Advanced Valuation Model: Automatic recalculation of Net Present Value (NPV) and intrinsic value as you adjust your inputs.
- Scenario Analysis: Develop various forecasting scenarios to explore different valuation results.
- Intuitive User Interface: Designed for ease of use, catering to both professionals and newcomers.
How It Works
- Step 1: Download the prebuilt Excel template that includes data for Jiangsu New Energy Development Co., Ltd. (603693SS).
- Step 2: Navigate through the pre-filled sheets to familiarize yourself with the key metrics.
- Step 3: Update the forecasts and assumptions in the editable yellow cells (WACC, growth, margins).
- Step 4: Instantly see the recalculated results, featuring Jiangsu New Energy's intrinsic value.
- Step 5: Use the outputs to make informed investment decisions or generate reports.
Why Choose This Calculator for Jiangsu New Energy Development Co., Ltd. (603693SS)?
- User-Friendly Interface: Tailored for both newcomers and seasoned professionals.
- Customizable Inputs: Easily alter assumptions to align with your financial analysis.
- Real-Time Feedback: Observe immediate updates to Jiangsu New Energy's valuation as you change parameters.
- Pre-Loaded Data: Comes equipped with Jiangsu New Energy's actual financial metrics for fast evaluation.
- Relied Upon by Experts: Favored by investors and analysts for sound decision-making.
Who Should Consider This Product?
- Investors: Evaluate the fair value of Jiangsu New Energy Development Co., Ltd. (603693SS) before making investment choices.
- CFOs: Utilize a professional-grade DCF model for comprehensive financial reporting and analysis.
- Consultants: Adapt the template efficiently for client valuation reports.
- Entrepreneurs: Discover insights into the financial modeling techniques employed by leading companies.
- Educators: Implement it as a teaching resource to illustrate various valuation methodologies.
Contents of the Template
- Preloaded JNED Data: Historical and projected financial metrics, including revenue, EBIT, and capital expenditures.
- DCF and WACC Models: Advanced spreadsheets designed for calculating intrinsic value and Weighted Average Cost of Capital.
- Editable Inputs: Yellow-highlighted cells for customized inputs on revenue growth, tax rates, and discount rates.
- Financial Statements: Detailed annual and quarterly financials for thorough analysis.
- Key Ratios: Metrics for profitability, leverage, and efficiency to assess performance.
- Dashboard and Charts: Visual representations of valuation results and underlying assumptions.
Disclaimer
All information, articles, and product details provided on this website are for general informational and educational purposes only. We do not claim any ownership over, nor do we intend to infringe upon, any trademarks, copyrights, logos, brand names, or other intellectual property mentioned or depicted on this site. Such intellectual property remains the property of its respective owners, and any references here are made solely for identification or informational purposes, without implying any affiliation, endorsement, or partnership.
We make no representations or warranties, express or implied, regarding the accuracy, completeness, or suitability of any content or products presented. Nothing on this website should be construed as legal, tax, investment, financial, medical, or other professional advice. In addition, no part of this site—including articles or product references—constitutes a solicitation, recommendation, endorsement, advertisement, or offer to buy or sell any securities, franchises, or other financial instruments, particularly in jurisdictions where such activity would be unlawful.
All content is of a general nature and may not address the specific circumstances of any individual or entity. It is not a substitute for professional advice or services. Any actions you take based on the information provided here are strictly at your own risk. You accept full responsibility for any decisions or outcomes arising from your use of this website and agree to release us from any liability in connection with your use of, or reliance upon, the content or products found herein.