
|
Xiangpiaopiao Food Co., Ltd (603711.SS) DCF -Bewertung |
Fully Editable: Tailor To Your Needs In Excel Or Sheets
Professional Design: Trusted, Industry-Standard Templates
Investor-Approved Valuation Models
MAC/PC Compatible, Fully Unlocked
No Expertise Is Needed; Easy To Follow
XIANGPIAOPIAO Food Co.,Ltd (603711.SS) Bundle
Bewerten Sie die finanziellen Aussichten von Xiangpiaopiao Food Co., Ltd wie ein Experte! Dieser (603711SS) DCF-Taschenrechner bietet Ihnen vorgefüllte Finanzdaten sowie die Flexibilität, das Umsatzwachstum, WACC, Margen und andere kritische Annahmen zu ändern, um sich an Ihren Projektionen auszurichten.
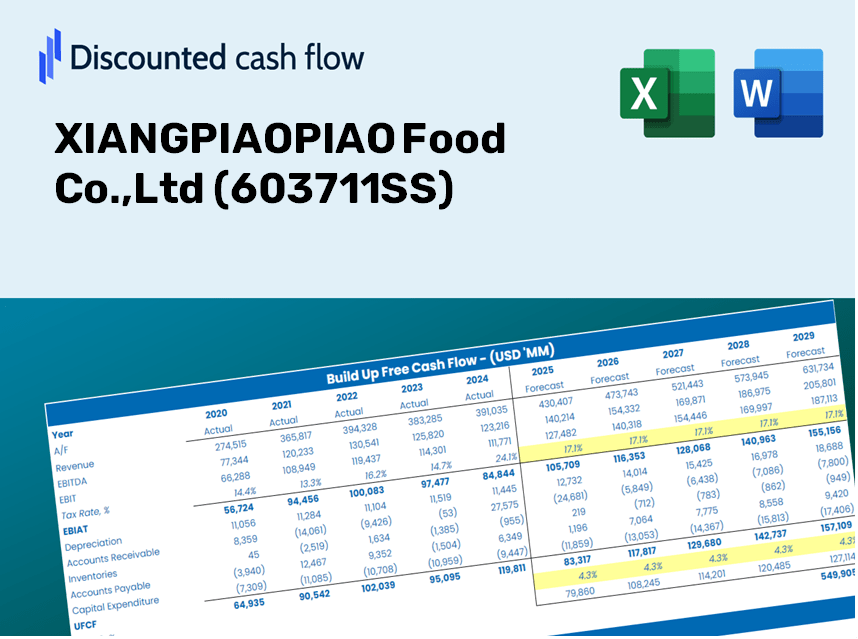
Discounted Cash Flow (DCF) - (USD MM)
| Year | AY1 2020 |
AY2 2021 |
AY3 2022 |
AY4 2023 |
AY5 2024 |
FY1 2025 |
FY2 2026 |
FY3 2027 |
FY4 2028 |
FY5 2029 |
|---|---|---|---|---|---|---|---|---|---|---|
| Revenue | 3,760.8 | 3,466.3 | 3,127.8 | 3,625.1 | 3,287.3 | 3,196.8 | 3,108.7 | 3,023.1 | 2,939.8 | 2,858.9 |
| Revenue Growth, % | 0 | -7.83 | -9.76 | 15.9 | -9.32 | -2.75 | -2.75 | -2.75 | -2.75 | -2.75 |
| EBITDA | 619.8 | 474.1 | 494.0 | 544.8 | 503.1 | 487.7 | 474.3 | 461.2 | 448.5 | 436.2 |
| EBITDA, % | 16.48 | 13.68 | 15.79 | 15.03 | 15.3 | 15.26 | 15.26 | 15.26 | 15.26 | 15.26 |
| Depreciation | 136.7 | 162.2 | 188.9 | 187.6 | 187.4 | 161.3 | 156.9 | 152.5 | 148.3 | 144.3 |
| Depreciation, % | 3.64 | 4.68 | 6.04 | 5.17 | 5.7 | 5.05 | 5.05 | 5.05 | 5.05 | 5.05 |
| EBIT | 483.1 | 312.0 | 305.1 | 357.2 | 315.7 | 326.4 | 317.4 | 308.7 | 300.2 | 291.9 |
| EBIT, % | 12.85 | 9 | 9.75 | 9.85 | 9.6 | 10.21 | 10.21 | 10.21 | 10.21 | 10.21 |
| Total Cash | 2,252.8 | 2,409.8 | 2,652.9 | 2,943.0 | 2,664.9 | 2,407.1 | 2,340.8 | 2,276.3 | 2,213.6 | 2,152.7 |
| Total Cash, percent | .0 | .0 | .0 | .0 | .0 | .0 | .0 | .0 | .0 | .0 |
| Account Receivables | 48.8 | 52.3 | 72.5 | 57.7 | 70.8 | 56.7 | 55.2 | 53.6 | 52.2 | 50.7 |
| Account Receivables, % | 1.3 | 1.51 | 2.32 | 1.59 | 2.15 | 1.77 | 1.77 | 1.77 | 1.77 | 1.77 |
| Inventories | 154.1 | 156.5 | 171.6 | 161.9 | 186.2 | 154.9 | 150.6 | 146.5 | 142.5 | 138.5 |
| Inventories, % | 4.1 | 4.52 | 5.49 | 4.47 | 5.66 | 4.85 | 4.85 | 4.85 | 4.85 | 4.85 |
| Accounts Payable | 382.5 | 345.5 | 493.7 | 413.8 | 271.6 | 355.5 | 345.7 | 336.2 | 326.9 | 317.9 |
| Accounts Payable, % | 10.17 | 9.97 | 15.78 | 11.41 | 8.26 | 11.12 | 11.12 | 11.12 | 11.12 | 11.12 |
| Capital Expenditure | -392.2 | -255.0 | -128.4 | -67.5 | -57.1 | -163.0 | -158.5 | -154.1 | -149.9 | -145.7 |
| Capital Expenditure, % | -10.43 | -7.36 | -4.1 | -1.86 | -1.74 | -5.1 | -5.1 | -5.1 | -5.1 | -5.1 |
| Tax Rate, % | 17.61 | 17.61 | 17.61 | 17.61 | 17.61 | 17.61 | 17.61 | 17.61 | 17.61 | 17.61 |
| EBITAT | 380.1 | 254.0 | 231.0 | 293.3 | 260.1 | 261.4 | 254.2 | 247.2 | 240.3 | 233.7 |
| Depreciation | ||||||||||
| Changes in Account Receivables | ||||||||||
| Changes in Inventories | ||||||||||
| Changes in Accounts Payable | ||||||||||
| Capital Expenditure | ||||||||||
| UFCF | 304.3 | 118.1 | 404.4 | 358.0 | 210.9 | 388.9 | 248.6 | 241.7 | 235.1 | 228.6 |
| WACC, % | 4.79 | 4.8 | 4.77 | 4.8 | 4.8 | 4.79 | 4.79 | 4.79 | 4.79 | 4.79 |
| PV UFCF | ||||||||||
| SUM PV UFCF | 1,183.5 | |||||||||
| Long Term Growth Rate, % | 3.50 | |||||||||
| Free cash flow (T + 1) | 237 | |||||||||
| Terminal Value | 18,336 | |||||||||
| Present Terminal Value | 14,511 | |||||||||
| Enterprise Value | 15,695 | |||||||||
| Net Debt | -1,810 | |||||||||
| Equity Value | 17,505 | |||||||||
| Diluted Shares Outstanding, MM | 408 | |||||||||
| Equity Value Per Share | 42.87 |
What You Will Receive
- Authentic XIANGPIAOPIAO Financial Data: Pre-loaded with historical and projected figures for comprehensive analysis.
- Customizable Template: Easily adjust critical inputs such as revenue growth, WACC, and EBITDA percentage.
- Instant Calculations: Watch the intrinsic value of XIANGPIAOPIAO update in real-time as you make adjustments.
- Expert Valuation Tool: Tailored for investors, analysts, and consultants seeking precise DCF outcomes.
- Intuitive Interface: Streamlined design and straightforward guidance suitable for all skill levels.
Key Features
- Customizable Forecast Inputs: Adjust essential metrics such as revenue growth, EBITDA %, and capital expenditures specific to XIANGPIAOPIAO Food Co., Ltd (603711SS).
- Instant DCF Valuation: Quickly computes intrinsic value, NPV, and additional outputs for (603711SS) at the click of a button.
- High-Precision Accuracy: Leverages real-world financial data from XIANGPIAOPIAO for reliable valuation results.
- Effortless Scenario Analysis: Easily explore various assumptions and assess impacts on outcomes for (603711SS).
- Efficiency Boost: Streamline the valuation process by eliminating the need to create intricate models from the ground up.
How It Works
- Step 1: Download the prebuilt Excel template featuring data for XIANGPIAOPIAO Food Co., Ltd (603711SS).
- Step 2: Navigate through the pre-filled sheets to familiarize yourself with the essential metrics.
- Step 3: Update your forecasts and assumptions in the editable yellow cells (WACC, growth, margins).
- Step 4: Instantly see the recalculated results, including the intrinsic value of XIANGPIAOPIAO Food Co., Ltd (603711SS).
- Step 5: Use the outputs to make informed investment decisions or create comprehensive reports.
Why Opt for XIANGPIAOPIAO Food Co., Ltd (603711SS)?
- Precision: Utilizes authentic financial data for reliable results.
- Adaptability: Tailored for users to experiment with and adjust inputs seamlessly.
- Efficiency: Eliminate the complexities of creating a financial model from the ground up.
- High-Quality: Crafted with the accuracy and usability expected at the CFO level.
- Intuitive: Simple to navigate, even for those without extensive financial modeling knowledge.
Who Can Benefit from XIANGPIAOPIAO Food Co., Ltd (603711SS)?
- Food Industry Students: Explore valuation methods and apply them to real-world data.
- Researchers: Integrate industry-specific models into your academic studies or research projects.
- Investors: Validate your hypotheses and evaluate the valuation metrics for XIANGPIAOPIAO Food Co., Ltd (603711SS).
- Market Analysts: Enhance your analysis process with a ready-made, adjustable DCF model.
- Entrepreneurs: Understand the evaluation strategies used for large public food companies like XIANGPIAOPIAO.
What the Template Includes
- Historical Data: Contains XIANGPIAOPIAO Food Co.,Ltd’s past financial performance and baseline forecasts.
- DCF and Levered DCF Models: Comprehensive templates for assessing the intrinsic value of XIANGPIAOPIAO Food Co.,Ltd (603711SS).
- WACC Sheet: Pre-configured calculations for the Weighted Average Cost of Capital.
- Editable Inputs: Adjust essential drivers such as growth rates, EBITDA percentages, and CAPEX assumptions.
- Quarterly and Annual Statements: A detailed overview of XIANGPIAOPIAO Food Co.,Ltd’s financials.
- Interactive Dashboard: Dynamically visualize valuation outcomes and forecasts.
Disclaimer
All information, articles, and product details provided on this website are for general informational and educational purposes only. We do not claim any ownership over, nor do we intend to infringe upon, any trademarks, copyrights, logos, brand names, or other intellectual property mentioned or depicted on this site. Such intellectual property remains the property of its respective owners, and any references here are made solely for identification or informational purposes, without implying any affiliation, endorsement, or partnership.
We make no representations or warranties, express or implied, regarding the accuracy, completeness, or suitability of any content or products presented. Nothing on this website should be construed as legal, tax, investment, financial, medical, or other professional advice. In addition, no part of this site—including articles or product references—constitutes a solicitation, recommendation, endorsement, advertisement, or offer to buy or sell any securities, franchises, or other financial instruments, particularly in jurisdictions where such activity would be unlawful.
All content is of a general nature and may not address the specific circumstances of any individual or entity. It is not a substitute for professional advice or services. Any actions you take based on the information provided here are strictly at your own risk. You accept full responsibility for any decisions or outcomes arising from your use of this website and agree to release us from any liability in connection with your use of, or reliance upon, the content or products found herein.