
|
Shanghai Moons 'Electric Co., Ltd. (603728.SS) DCF -Bewertung |
Fully Editable: Tailor To Your Needs In Excel Or Sheets
Professional Design: Trusted, Industry-Standard Templates
Investor-Approved Valuation Models
MAC/PC Compatible, Fully Unlocked
No Expertise Is Needed; Easy To Follow
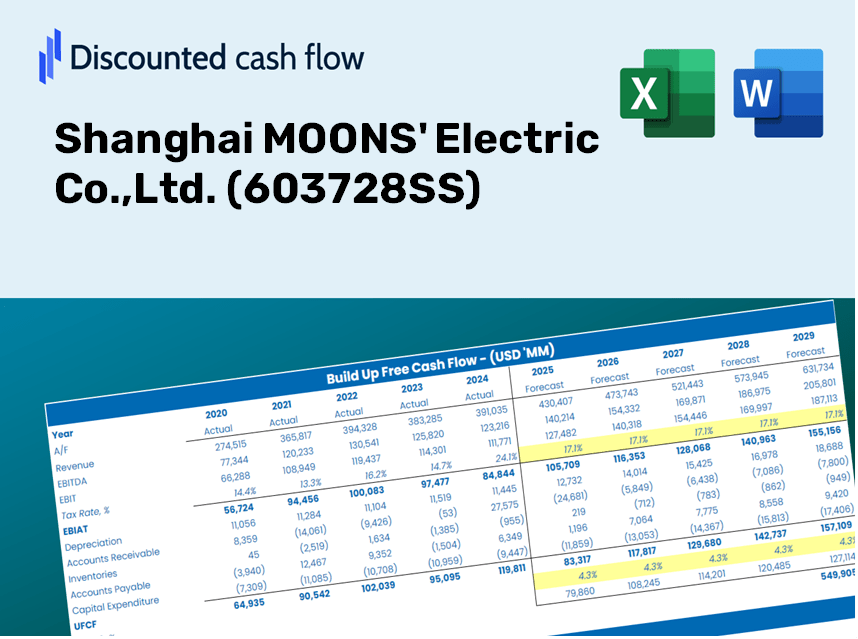
Shanghai MOONS' Electric Co.,Ltd. (603728.SS) Bundle
Vereinfachen Sie die Bewertung von Shanghai Moons 'Electric Co., Ltd. (603728SS) mit diesem anpassbaren DCF -Taschenrechner! Mit Real Shanghai Moons 'Electric Co., Ltd. (603728S) Finanzdaten und einstellbaren Prognoseeingaben können Sie Szenarien testen und Shanghai Moons' Electric Co., Ltd. (603728SS) faire Wert in Minuten aufdecken.
Discounted Cash Flow (DCF) - (USD MM)
| Year | AY1 2020 |
AY2 2021 |
AY3 2022 |
AY4 2023 |
AY5 2024 |
FY1 2025 |
FY2 2026 |
FY3 2027 |
FY4 2028 |
FY5 2029 |
|---|---|---|---|---|---|---|---|---|---|---|
| Revenue | 2,212.8 | 2,714.2 | 2,960.0 | 2,542.8 | 2,415.9 | 2,492.2 | 2,570.9 | 2,652.1 | 2,735.8 | 2,822.2 |
| Revenue Growth, % | 0 | 22.66 | 9.05 | -14.09 | -4.99 | 3.16 | 3.16 | 3.16 | 3.16 | 3.16 |
| EBITDA | 319.3 | 354.6 | 320.9 | 218.7 | 132.9 | 261.4 | 269.6 | 278.1 | 286.9 | 296.0 |
| EBITDA, % | 14.43 | 13.07 | 10.84 | 8.6 | 5.5 | 10.49 | 10.49 | 10.49 | 10.49 | 10.49 |
| Depreciation | 54.9 | 57.5 | 61.5 | 81.1 | 78.4 | 65.4 | 67.4 | 69.6 | 71.8 | 74.0 |
| Depreciation, % | 2.48 | 2.12 | 2.08 | 3.19 | 3.25 | 2.62 | 2.62 | 2.62 | 2.62 | 2.62 |
| EBIT | 264.4 | 297.2 | 259.3 | 137.6 | 54.4 | 196.0 | 202.2 | 208.6 | 215.1 | 221.9 |
| EBIT, % | 11.95 | 10.95 | 8.76 | 5.41 | 2.25 | 7.86 | 7.86 | 7.86 | 7.86 | 7.86 |
| Total Cash | 697.9 | 616.9 | 560.4 | 644.5 | 760.0 | 648.0 | 668.5 | 689.6 | 711.3 | 733.8 |
| Total Cash, percent | .0 | .0 | .0 | .0 | .0 | .0 | .0 | .0 | .0 | .0 |
| Account Receivables | 610.3 | 688.4 | 812.9 | 712.9 | 840.8 | 714.0 | 736.5 | 759.8 | 783.8 | 808.5 |
| Account Receivables, % | 27.58 | 25.36 | 27.46 | 28.04 | 34.8 | 28.65 | 28.65 | 28.65 | 28.65 | 28.65 |
| Inventories | 340.6 | 577.8 | 748.3 | 642.8 | 572.2 | 552.9 | 570.4 | 588.4 | 606.9 | 626.1 |
| Inventories, % | 15.39 | 21.29 | 25.28 | 25.28 | 23.69 | 22.19 | 22.19 | 22.19 | 22.19 | 22.19 |
| Accounts Payable | 301.3 | 470.6 | 471.2 | 315.6 | 332.6 | 364.1 | 375.6 | 387.5 | 399.7 | 412.3 |
| Accounts Payable, % | 13.61 | 17.34 | 15.92 | 12.41 | 13.77 | 14.61 | 14.61 | 14.61 | 14.61 | 14.61 |
| Capital Expenditure | -145.7 | -236.6 | -199.7 | -195.0 | -297.7 | -209.5 | -216.2 | -223.0 | -230.0 | -237.3 |
| Capital Expenditure, % | -6.58 | -8.72 | -6.75 | -7.67 | -12.32 | -8.41 | -8.41 | -8.41 | -8.41 | -8.41 |
| Tax Rate, % | -3.23 | -3.23 | -3.23 | -3.23 | -3.23 | -3.23 | -3.23 | -3.23 | -3.23 | -3.23 |
| EBITAT | 226.9 | 272.6 | 225.0 | 130.1 | 56.2 | 179.9 | 185.5 | 191.4 | 197.4 | 203.7 |
| Depreciation | ||||||||||
| Changes in Account Receivables | ||||||||||
| Changes in Inventories | ||||||||||
| Changes in Accounts Payable | ||||||||||
| Capital Expenditure | ||||||||||
| UFCF | -513.4 | -52.6 | -207.5 | 66.0 | -203.3 | 213.3 | 8.3 | 8.6 | 8.9 | 9.1 |
| WACC, % | 6.48 | 6.48 | 6.48 | 6.48 | 6.49 | 6.48 | 6.48 | 6.48 | 6.48 | 6.48 |
| PV UFCF | ||||||||||
| SUM PV UFCF | 228.3 | |||||||||
| Long Term Growth Rate, % | 4.00 | |||||||||
| Free cash flow (T + 1) | 10 | |||||||||
| Terminal Value | 383 | |||||||||
| Present Terminal Value | 280 | |||||||||
| Enterprise Value | 508 | |||||||||
| Net Debt | -269 | |||||||||
| Equity Value | 777 | |||||||||
| Diluted Shares Outstanding, MM | 419 | |||||||||
| Equity Value Per Share | 1.85 |
What You Will Receive
- Adjustable Forecast Parameters: Effortlessly modify key assumptions (growth rate, profit margins, WACC) to explore various scenarios.
- Comprehensive Market Data: Pre-filled financial information for Shanghai MOONS' Electric Co., Ltd. (603728SS) to kickstart your analysis.
- Automated DCF Calculations: The template generates Net Present Value (NPV) and intrinsic value calculations automatically.
- Flexible and Professional Design: A sophisticated Excel model tailored to meet your valuation requirements.
- Designed for Analysts and Investors: Perfect for evaluating forecasts, confirming strategies, and optimizing efficiency.
Key Features
- Comprehensive Data: Access to Shanghai MOONS' Electric Co., Ltd.'s historical financial reports and projected forecasts.
- Customizable Parameters: Adjust WACC, tax rates, revenue growth, and EBITDA margins to fit your analysis.
- Real-Time Calculations: Watch the intrinsic value of Shanghai MOONS' Electric Co., Ltd. (603728SS) update instantly.
- Insightful Visualizations: Dashboard charts showcase valuation results and essential metrics clearly.
- Engineered for Precision: A reliable tool designed for analysts, investors, and finance professionals.
How It Works
- Step 1: Download the prebuilt Excel template featuring Shanghai MOONS' Electric Co., Ltd.'s data.
- Step 2: Review the pre-filled sheets to familiarize yourself with the essential metrics.
- Step 3: Modify forecasts and assumptions in the editable yellow cells (WACC, growth, margins).
- Step 4: See recalculated results instantly, including the intrinsic value of Shanghai MOONS' Electric Co., Ltd. (603728SS).
- Step 5: Utilize the outputs to make informed investment decisions or to create detailed reports.
Reasons to Choose Shanghai MOONS' Electric Co., Ltd. (603728SS)
- Time Efficient: No need to start from scratch – our solutions are ready for immediate use.
- Enhanced Precision: Our reliable data and calculations minimize errors in financial assessments.
- Fully Adaptable: Customize our solutions to align with your specific assumptions and forecasts.
- Simple to Understand: Intuitive charts and outputs facilitate straightforward analysis of results.
- Endorsed by Professionals: Crafted for experts who prioritize accuracy and user-friendliness.
Who Should Use This Product?
- Engineering Students: Explore cutting-edge technologies and apply them to real-world scenarios.
- Researchers: Integrate advanced models and findings into your academic work.
- Investors: Validate your investment strategies and evaluate the market performance of Shanghai MOONS' Electric Co., Ltd. (603728SS).
- Industry Analysts: Enhance your analysis with a ready-to-use, customizable financial model.
- Entrepreneurs: Understand the methodologies behind the assessment of prominent companies like Shanghai MOONS' Electric Co., Ltd. (603728SS).
Contents of the Template
- Preloaded MOONS' Data: Historical and projected financial metrics, including revenue, EBIT, and capital expenditures.
- DCF and WACC Models: Advanced spreadsheets for calculating intrinsic value and Weighted Average Cost of Capital.
- Editable Inputs: Yellow-highlighted cells for modifying revenue growth, tax rates, and discount rates.
- Financial Statements: Detailed annual and quarterly financials for in-depth analysis.
- Key Ratios: Metrics for profitability, leverage, and efficiency to assess company performance.
- Dashboard and Charts: Visual representations of valuation results and underlying assumptions.
Disclaimer
All information, articles, and product details provided on this website are for general informational and educational purposes only. We do not claim any ownership over, nor do we intend to infringe upon, any trademarks, copyrights, logos, brand names, or other intellectual property mentioned or depicted on this site. Such intellectual property remains the property of its respective owners, and any references here are made solely for identification or informational purposes, without implying any affiliation, endorsement, or partnership.
We make no representations or warranties, express or implied, regarding the accuracy, completeness, or suitability of any content or products presented. Nothing on this website should be construed as legal, tax, investment, financial, medical, or other professional advice. In addition, no part of this site—including articles or product references—constitutes a solicitation, recommendation, endorsement, advertisement, or offer to buy or sell any securities, franchises, or other financial instruments, particularly in jurisdictions where such activity would be unlawful.
All content is of a general nature and may not address the specific circumstances of any individual or entity. It is not a substitute for professional advice or services. Any actions you take based on the information provided here are strictly at your own risk. You accept full responsibility for any decisions or outcomes arising from your use of this website and agree to release us from any liability in connection with your use of, or reliance upon, the content or products found herein.