
|
Loncin Motor Co., Ltd. (603766.SS) DCF -Bewertung |
Fully Editable: Tailor To Your Needs In Excel Or Sheets
Professional Design: Trusted, Industry-Standard Templates
Investor-Approved Valuation Models
MAC/PC Compatible, Fully Unlocked
No Expertise Is Needed; Easy To Follow
Loncin Motor Co., Ltd. (603766.SS) Bundle
Streamline Loncin Motor Co., Ltd. (603766SS) Bewertung mit diesem anpassbaren DCF -Taschenrechner! Ausgestattet mit Real Loncin Motor Co., Ltd. (603766S) Finanzdaten und einstellbaren Prognoseeingaben können Sie mit Szenarien experimentieren und Loncin Motor Co., Ltd. (603766S) in nur wenigen Minuten zu bestimmen.
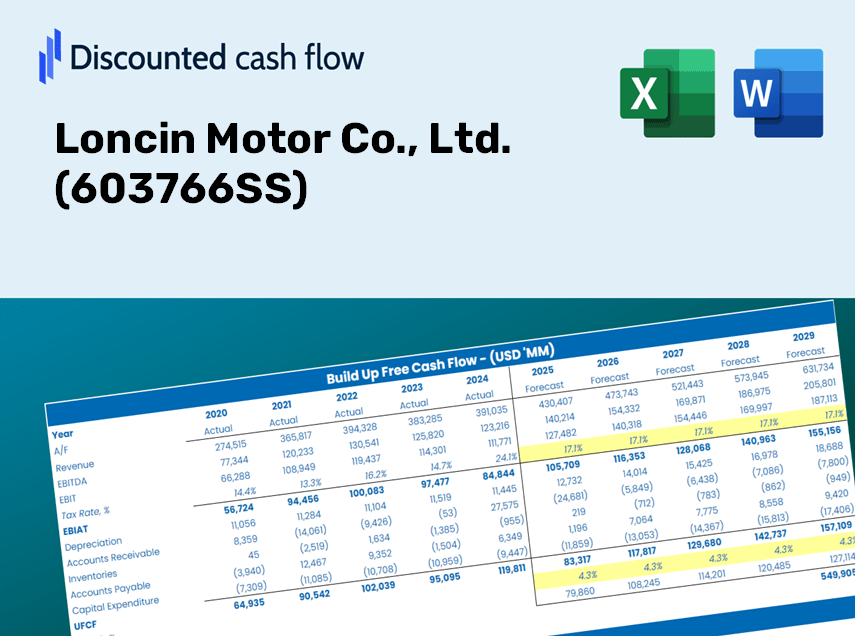
Discounted Cash Flow (DCF) - (USD MM)
| Year | AY1 2020 |
AY2 2021 |
AY3 2022 |
AY4 2023 |
AY5 2024 |
FY1 2025 |
FY2 2026 |
FY3 2027 |
FY4 2028 |
FY5 2029 |
|---|---|---|---|---|---|---|---|---|---|---|
| Revenue | 10,437.1 | 13,057.9 | 12,410.2 | 13,066.5 | 16,822.2 | 19,100.9 | 21,688.3 | 24,626.1 | 27,961.8 | 31,749.4 |
| Revenue Growth, % | 0 | 25.11 | -4.96 | 5.29 | 28.74 | 13.55 | 13.55 | 13.55 | 13.55 | 13.55 |
| EBITDA | 1,070.5 | 965.8 | 1,111.1 | 1,043.3 | 1,841.0 | 1,739.5 | 1,975.1 | 2,242.7 | 2,546.5 | 2,891.4 |
| EBITDA, % | 10.26 | 7.4 | 8.95 | 7.98 | 10.94 | 9.11 | 9.11 | 9.11 | 9.11 | 9.11 |
| Depreciation | 490.2 | 453.1 | 504.6 | 455.9 | 522.5 | 719.2 | 816.7 | 927.3 | 1,052.9 | 1,195.5 |
| Depreciation, % | 4.7 | 3.47 | 4.07 | 3.49 | 3.11 | 3.77 | 3.77 | 3.77 | 3.77 | 3.77 |
| EBIT | 580.4 | 512.7 | 606.5 | 587.4 | 1,318.5 | 1,020.3 | 1,158.5 | 1,315.4 | 1,493.6 | 1,695.9 |
| EBIT, % | 5.56 | 3.93 | 4.89 | 4.5 | 7.84 | 5.34 | 5.34 | 5.34 | 5.34 | 5.34 |
| Total Cash | 2,865.6 | 3,045.5 | 4,120.4 | 5,603.5 | 6,759.7 | 6,381.5 | 7,246.0 | 8,227.5 | 9,341.9 | 10,607.3 |
| Total Cash, percent | .0 | .0 | .0 | .0 | .0 | .0 | .0 | .0 | .0 | .0 |
| Account Receivables | 2,448.2 | 2,203.7 | 1,738.9 | 1,782.4 | 2,347.2 | 3,130.2 | 3,554.3 | 4,035.7 | 4,582.4 | 5,203.1 |
| Account Receivables, % | 23.46 | 16.88 | 14.01 | 13.64 | 13.95 | 16.39 | 16.39 | 16.39 | 16.39 | 16.39 |
| Inventories | 1,049.7 | 1,325.1 | 824.2 | 702.6 | 1,003.2 | 1,458.8 | 1,656.4 | 1,880.8 | 2,135.6 | 2,424.9 |
| Inventories, % | 10.06 | 10.15 | 6.64 | 5.38 | 5.96 | 7.64 | 7.64 | 7.64 | 7.64 | 7.64 |
| Accounts Payable | 2,808.3 | 3,107.3 | 2,151.9 | 2,720.2 | 3,399.1 | 4,166.6 | 4,731.0 | 5,371.8 | 6,099.5 | 6,925.7 |
| Accounts Payable, % | 26.91 | 23.8 | 17.34 | 20.82 | 20.21 | 21.81 | 21.81 | 21.81 | 21.81 | 21.81 |
| Capital Expenditure | -501.7 | -684.0 | -576.9 | -535.5 | -674.5 | -871.1 | -989.1 | -1,123.1 | -1,275.2 | -1,447.9 |
| Capital Expenditure, % | -4.81 | -5.24 | -4.65 | -4.1 | -4.01 | -4.56 | -4.56 | -4.56 | -4.56 | -4.56 |
| Tax Rate, % | 12.1 | 12.1 | 12.1 | 12.1 | 12.1 | 12.1 | 12.1 | 12.1 | 12.1 | 12.1 |
| EBITAT | 513.2 | 402.2 | 544.7 | 613.6 | 1,159.0 | 907.2 | 1,030.1 | 1,169.6 | 1,328.1 | 1,508.0 |
| Depreciation | ||||||||||
| Changes in Account Receivables | ||||||||||
| Changes in Inventories | ||||||||||
| Changes in Accounts Payable | ||||||||||
| Capital Expenditure | ||||||||||
| UFCF | -188.0 | 439.3 | 482.8 | 1,180.5 | 820.3 | 284.2 | 800.5 | 908.9 | 1,032.0 | 1,171.8 |
| WACC, % | 5.02 | 5 | 5.02 | 5.04 | 5.02 | 5.02 | 5.02 | 5.02 | 5.02 | 5.02 |
| PV UFCF | ||||||||||
| SUM PV UFCF | 3,546.9 | |||||||||
| Long Term Growth Rate, % | 3.00 | |||||||||
| Free cash flow (T + 1) | 1,207 | |||||||||
| Terminal Value | 59,808 | |||||||||
| Present Terminal Value | 46,821 | |||||||||
| Enterprise Value | 50,368 | |||||||||
| Net Debt | -6,433 | |||||||||
| Equity Value | 56,801 | |||||||||
| Diluted Shares Outstanding, MM | 2,039 | |||||||||
| Equity Value Per Share | 27.86 |
Benefits of Choosing Loncin Motor Co., Ltd. (603766SS)
- Genuine Financial Insights: Access to both historical and projected data for precise valuation.
- Customizable Parameters: Adjust key inputs such as WACC, tax rates, revenue growth, and capital expenditures.
- Automated Calculations: Dynamic computation of intrinsic value and NPV for real-time analysis.
- Scenario Simulation: Explore various scenarios to assess Loncin's potential future performance.
- User-Friendly Interface: Designed for industry professionals while remaining approachable for newcomers.
Key Features
- Comprehensive DCF Model: Offers intricate unlevered and levered DCF valuation frameworks.
- WACC Estimator: Comes with a pre-configured Weighted Average Cost of Capital sheet that allows for adjustable inputs.
- Customizable Forecast Variables: Easily modify growth projections, capital investments, and discount rates.
- Integrated Financial Ratios: Evaluate profitability, leverage, and efficiency metrics specifically for Loncin Motor Co., Ltd. (603766SS).
- Interactive Dashboard and Graphs: Visual representations that condense essential valuation indicators for straightforward analysis.
How It Operates
- Download the Template: Gain immediate access to the Excel-based Loncin Motor Co., Ltd. ([603766SS]) DCF Calculator.
- Input Your Assumptions: Modify the yellow-highlighted cells for growth rates, WACC, profit margins, and additional parameters.
- Instant Calculations: The model automatically calculates Loncin Motor’s intrinsic value.
- Test Scenarios: Experiment with various assumptions to assess potential changes in valuation.
- Analyze and Decide: Leverage the results to inform your investment or financial assessments.
Why Choose Loncin Motor Co., Ltd. ([603766SS]) Calculator?
- All-in-One Solution: Integrates DCF, WACC, and financial ratio assessments seamlessly.
- Flexible Parameters: Modify the highlighted fields to explore different investment scenarios.
- In-Depth Analysis: Automatically computes Loncin's intrinsic value and Net Present Value.
- Preloaded Information: Comes with historical and projected data for reliable evaluations.
- Expert-Grade Tool: Perfect for financial analysts, investors, and business advisors.
Who Can Benefit from Loncin Motor Co., Ltd. (603766SS)?
- Finance Students: Explore valuation methods and practice applying them with real-world data.
- Academics: Utilize industry-standard models in your coursework or research projects.
- Investors: Evaluate your own hypotheses and assess valuation results for Loncin Motor Co., Ltd. (603766SS).
- Analysts: Enhance your efficiency with a ready-to-use and customizable DCF model.
- Small Business Owners: Understand the analytical processes used for major public companies like Loncin Motor Co., Ltd. (603766SS).
Contents of the Template
- Comprehensive DCF Model: An editable template featuring extensive valuation calculations.
- Real-World Data: Loncin Motor Co., Ltd.’s (603766SS) historical and projected financials preloaded for thorough analysis.
- Customizable Parameters: Modify WACC, growth rates, and tax assumptions to explore different scenarios.
- Financial Statements: Complete annual and quarterly breakdowns for more in-depth insights.
- Key Ratios: Integrated analysis for profitability, efficiency, and leverage metrics.
- Dashboard with Visual Outputs: Charts and tables providing clear, actionable results.
Disclaimer
All information, articles, and product details provided on this website are for general informational and educational purposes only. We do not claim any ownership over, nor do we intend to infringe upon, any trademarks, copyrights, logos, brand names, or other intellectual property mentioned or depicted on this site. Such intellectual property remains the property of its respective owners, and any references here are made solely for identification or informational purposes, without implying any affiliation, endorsement, or partnership.
We make no representations or warranties, express or implied, regarding the accuracy, completeness, or suitability of any content or products presented. Nothing on this website should be construed as legal, tax, investment, financial, medical, or other professional advice. In addition, no part of this site—including articles or product references—constitutes a solicitation, recommendation, endorsement, advertisement, or offer to buy or sell any securities, franchises, or other financial instruments, particularly in jurisdictions where such activity would be unlawful.
All content is of a general nature and may not address the specific circumstances of any individual or entity. It is not a substitute for professional advice or services. Any actions you take based on the information provided here are strictly at your own risk. You accept full responsibility for any decisions or outcomes arising from your use of this website and agree to release us from any liability in connection with your use of, or reliance upon, the content or products found herein.