
|
L & K Engineering Co., Ltd. (603929.SS) DCF -Bewertung |
Fully Editable: Tailor To Your Needs In Excel Or Sheets
Professional Design: Trusted, Industry-Standard Templates
Investor-Approved Valuation Models
MAC/PC Compatible, Fully Unlocked
No Expertise Is Needed; Easy To Follow
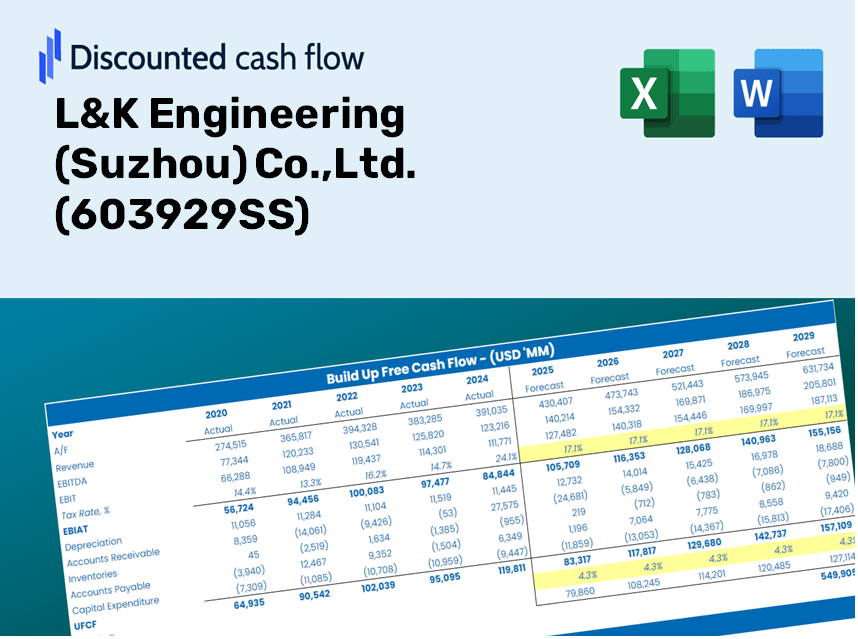
L&K Engineering (Suzhou) Co.,Ltd. (603929.SS) Bundle
Entdecken Sie das wahre Potenzial von L & K Engineering (Suzhou) Co., Ltd. (603929S) mit unserem fortschrittlichen DCF -Taschenrechner! Passen Sie kritische Annahmen an, erkunden Sie verschiedene Szenarien und bewerten Sie, wie Änderungen die Bewertung von L & K Engineering (Suzhou) Co., Ltd. (603929S) beeinflussen - alles innerhalb einer einzigen Excel -Vorlage.
Discounted Cash Flow (DCF) - (USD MM)
| Year | AY1 2020 |
AY2 2021 |
AY3 2022 |
AY4 2023 |
AY5 2024 |
FY1 2025 |
FY2 2026 |
FY3 2027 |
FY4 2028 |
FY5 2029 |
|---|---|---|---|---|---|---|---|---|---|---|
| Revenue | 929.4 | 2,212.1 | 3,039.2 | 3,201.1 | 5,380.7 | 8,216.3 | 12,546.4 | 19,158.5 | 29,255.2 | 44,673.0 |
| Revenue Growth, % | 0 | 138.02 | 37.39 | 5.33 | 68.09 | 52.7 | 52.7 | 52.7 | 52.7 | 52.7 |
| EBITDA | -40.0 | 28.6 | 177.1 | 304.3 | 694.9 | 414.8 | 633.3 | 967.1 | 1,476.8 | 2,255.1 |
| EBITDA, % | -4.3 | 1.29 | 5.83 | 9.51 | 12.91 | 5.05 | 5.05 | 5.05 | 5.05 | 5.05 |
| Depreciation | 5.1 | 7.0 | 7.8 | 8.4 | 7.4 | 25.0 | 38.2 | 58.4 | 89.2 | 136.1 |
| Depreciation, % | 0.54982 | 0.31801 | 0.25534 | 0.26358 | 0.13702 | 0.30475 | 0.30475 | 0.30475 | 0.30475 | 0.30475 |
| EBIT | -45.1 | 21.5 | 169.3 | 295.9 | 687.5 | 389.7 | 595.1 | 908.7 | 1,387.6 | 2,118.9 |
| EBIT, % | -4.85 | 0.97343 | 5.57 | 9.24 | 12.78 | 4.74 | 4.74 | 4.74 | 4.74 | 4.74 |
| Total Cash | 481.1 | 436.2 | 637.8 | 1,086.8 | 2,492.1 | 2,838.6 | 4,334.5 | 6,618.9 | 10,107.1 | 15,433.6 |
| Total Cash, percent | .0 | .0 | .0 | .0 | .0 | .0 | .0 | .0 | .0 | .0 |
| Account Receivables | 1,207.5 | 1,452.2 | 1,521.3 | 2,055.9 | 1,168.4 | 4,956.8 | 7,569.1 | 11,558.1 | 17,649.3 | 26,950.7 |
| Account Receivables, % | 129.92 | 65.65 | 50.06 | 64.22 | 21.72 | 60.33 | 60.33 | 60.33 | 60.33 | 60.33 |
| Inventories | 13.3 | 30.8 | 53.4 | 25.3 | 8.3 | 90.7 | 138.5 | 211.5 | 323.0 | 493.2 |
| Inventories, % | 1.43 | 1.39 | 1.76 | 0.7906 | 0.15517 | 1.1 | 1.1 | 1.1 | 1.1 | 1.1 |
| Accounts Payable | 719.4 | 987.0 | 1,079.7 | 1,626.5 | 1,579.4 | 3,906.2 | 5,964.8 | 9,108.4 | 13,908.6 | 21,238.5 |
| Accounts Payable, % | 77.4 | 44.62 | 35.53 | 50.81 | 29.35 | 47.54 | 47.54 | 47.54 | 47.54 | 47.54 |
| Capital Expenditure | -16.8 | -5.8 | -17.0 | -5.2 | -3.1 | -46.8 | -71.5 | -109.2 | -166.8 | -254.6 |
| Capital Expenditure, % | -1.81 | -0.26052 | -0.55825 | -0.16091 | -0.05741498 | -0.57 | -0.57 | -0.57 | -0.57 | -0.57 |
| Tax Rate, % | 15.16 | 15.16 | 15.16 | 15.16 | 15.16 | 15.16 | 15.16 | 15.16 | 15.16 | 15.16 |
| EBITAT | -39.4 | 20.1 | 141.8 | 245.5 | 583.2 | 337.1 | 514.8 | 786.1 | 1,200.4 | 1,833.0 |
| Depreciation | ||||||||||
| Changes in Account Receivables | ||||||||||
| Changes in Inventories | ||||||||||
| Changes in Accounts Payable | ||||||||||
| Capital Expenditure | ||||||||||
| UFCF | -552.6 | 26.8 | 133.6 | 289.1 | 1,444.8 | -1,228.6 | -119.9 | -183.2 | -279.7 | -427.1 |
| WACC, % | 5.53 | 5.53 | 5.53 | 5.53 | 5.53 | 5.53 | 5.53 | 5.53 | 5.53 | 5.53 |
| PV UFCF | ||||||||||
| SUM PV UFCF | -1,979.7 | |||||||||
| Long Term Growth Rate, % | 2.00 | |||||||||
| Free cash flow (T + 1) | -436 | |||||||||
| Terminal Value | -12,349 | |||||||||
| Present Terminal Value | -9,436 | |||||||||
| Enterprise Value | -11,416 | |||||||||
| Net Debt | -2,484 | |||||||||
| Equity Value | -8,932 | |||||||||
| Diluted Shares Outstanding, MM | 213 | |||||||||
| Equity Value Per Share | -41.86 |
What You Will Receive
- Authentic L&K Engineering Financials: Access to historical and projected data for precise valuation.
- Customizable Inputs: Adjust parameters such as WACC, tax rates, revenue growth, and capital expenditures.
- Automatic Calculations: Intrinsic value and NPV are computed in real-time.
- Scenario Analysis: Explore various scenarios to assess L&K Engineering's future performance.
- User-Friendly Design: Crafted for industry professionals while remaining approachable for newcomers.
Key Features
- 🔍 Real-Life L&K Engineering Financials: Pre-filled historical and projected data for L&K Engineering (603929SS).
- ✏️ Fully Customizable Inputs: Modify all essential parameters (yellow cells) such as WACC, growth %, and tax rates.
- 📊 Professional DCF Valuation: Integrated formulas calculate the intrinsic value of L&K Engineering using the Discounted Cash Flow method.
- ⚡ Instant Results: View L&K Engineering’s valuation immediately after adjusting inputs.
- Scenario Analysis: Evaluate and contrast outcomes for different financial assumptions side-by-side.
How It Works
- 1. Access the Template: Download and open the Excel file containing L&K Engineering’s preloaded data.
- 2. Modify Assumptions: Adjust key parameters such as growth projections, WACC, and capital investments.
- 3. Get Instant Results: The DCF model automatically computes intrinsic value and NPV.
- 4. Evaluate Scenarios: Analyze various forecasts to explore different valuation scenarios.
- 5. Present with Confidence: Showcase professional valuation insights to back your decision-making.
Why Opt for This Calculator?
- Reliable Data: Utilizing actual financials from L&K Engineering (Suzhou) Co., Ltd. (603929SS) ensures dependable valuation outcomes.
- Flexible Options: Modify essential inputs such as growth rates, WACC, and tax rates to align with your forecasts.
- Efficiency Boost: Pre-existing calculations save you the hassle of starting anew.
- Expert-Quality Tool: Tailored for investors, analysts, and consultants in the engineering sector.
- Easy to Use: A straightforward design and clear instructions make it accessible for everyone.
Who Can Benefit from This Product?
- Professional Engineers: Develop precise and reliable models for project assessments.
- Corporate Development Teams: Evaluate engineering scenarios to inform strategic decisions.
- Consultants and Advisors: Deliver accurate engineering insights for L&K Engineering (603929SS).
- Students and Instructors: Utilize real-world data to practice and teach engineering principles.
- Industry Enthusiasts: Gain insights into how engineering firms like L&K Engineering are valued in the market.
Contents of the Template
- Detailed DCF Model: An editable template featuring in-depth valuation calculations.
- Actual Financial Data: L&K Engineering (Suzhou) Co., Ltd. (603929SS) historical and projected financials preloaded for thorough analysis.
- Adjustable Assumptions: Modify WACC, growth rates, and tax inputs to explore various scenarios.
- Comprehensive Financial Statements: Complete annual and quarterly analyses for enhanced understanding.
- Essential Ratios: Integrated assessments for measuring profitability, efficiency, and leverage.
- Interactive Dashboard with Visual Representations: Graphs and tables for concise, actionable insights.
Disclaimer
All information, articles, and product details provided on this website are for general informational and educational purposes only. We do not claim any ownership over, nor do we intend to infringe upon, any trademarks, copyrights, logos, brand names, or other intellectual property mentioned or depicted on this site. Such intellectual property remains the property of its respective owners, and any references here are made solely for identification or informational purposes, without implying any affiliation, endorsement, or partnership.
We make no representations or warranties, express or implied, regarding the accuracy, completeness, or suitability of any content or products presented. Nothing on this website should be construed as legal, tax, investment, financial, medical, or other professional advice. In addition, no part of this site—including articles or product references—constitutes a solicitation, recommendation, endorsement, advertisement, or offer to buy or sell any securities, franchises, or other financial instruments, particularly in jurisdictions where such activity would be unlawful.
All content is of a general nature and may not address the specific circumstances of any individual or entity. It is not a substitute for professional advice or services. Any actions you take based on the information provided here are strictly at your own risk. You accept full responsibility for any decisions or outcomes arising from your use of this website and agree to release us from any liability in connection with your use of, or reliance upon, the content or products found herein.