
|
Hunan Aihua Group Co., Ltd (603989.SS) DCF -Bewertung |
Fully Editable: Tailor To Your Needs In Excel Or Sheets
Professional Design: Trusted, Industry-Standard Templates
Investor-Approved Valuation Models
MAC/PC Compatible, Fully Unlocked
No Expertise Is Needed; Easy To Follow
Hunan Aihua Group Co., Ltd (603989.SS) Bundle
Vereinfachen Sie die Bewertung der Hunan Aihua Group Co., Ltd (603989S) mit diesem anpassbaren DCF -Taschenrechner! Mit Real Hunan Aihua Group Co., Ltd (603989SS) Finanzdaten und einstellbaren Prognoseeingaben können Sie Szenarien testen und die Hunan Aihua Group Co., Ltd. (603989S) in wenigen Minuten fairen Wert aufdecken.
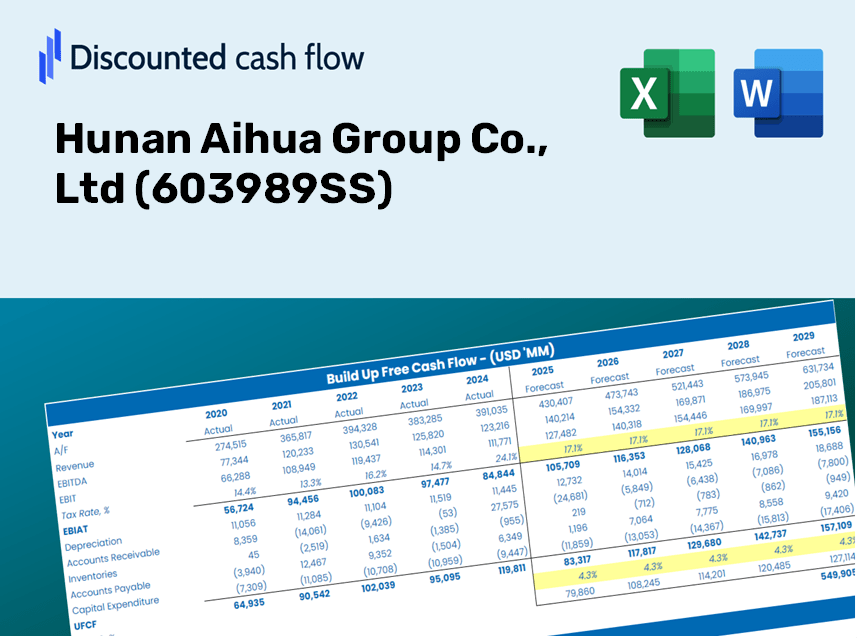
Discounted Cash Flow (DCF) - (USD MM)
| Year | AY1 2020 |
AY2 2021 |
AY3 2022 |
AY4 2023 |
AY5 2024 |
FY1 2025 |
FY2 2026 |
FY3 2027 |
FY4 2028 |
FY5 2029 |
|---|---|---|---|---|---|---|---|---|---|---|
| Revenue | 2,516.6 | 3,234.1 | 3,444.9 | 3,378.9 | 3,911.6 | 4,389.6 | 4,926.0 | 5,527.9 | 6,203.4 | 6,961.5 |
| Revenue Growth, % | 0 | 28.51 | 6.52 | -1.91 | 15.76 | 12.22 | 12.22 | 12.22 | 12.22 | 12.22 |
| EBITDA | 546.6 | 590.2 | 622.7 | 549.8 | 407.3 | 743.9 | 834.8 | 936.8 | 1,051.2 | 1,179.7 |
| EBITDA, % | 21.72 | 18.25 | 18.08 | 16.27 | 10.41 | 16.95 | 16.95 | 16.95 | 16.95 | 16.95 |
| Depreciation | 123.7 | 129.1 | 163.2 | 182.0 | 186.7 | 209.0 | 234.5 | 263.2 | 295.3 | 331.4 |
| Depreciation, % | 4.92 | 3.99 | 4.74 | 5.39 | 4.77 | 4.76 | 4.76 | 4.76 | 4.76 | 4.76 |
| EBIT | 422.9 | 461.1 | 459.5 | 367.8 | 220.6 | 534.9 | 600.2 | 673.6 | 755.9 | 848.3 |
| EBIT, % | 16.81 | 14.26 | 13.34 | 10.88 | 5.64 | 12.19 | 12.19 | 12.19 | 12.19 | 12.19 |
| Total Cash | 1,048.4 | 1,353.5 | 1,332.8 | 1,465.9 | 1,216.2 | 1,726.7 | 1,937.7 | 2,174.4 | 2,440.1 | 2,738.3 |
| Total Cash, percent | .0 | .0 | .0 | .0 | .0 | .0 | .0 | .0 | .0 | .0 |
| Account Receivables | 1,202.8 | 1,349.6 | 1,386.8 | 1,448.9 | 1,666.0 | 1,889.7 | 2,120.7 | 2,379.8 | 2,670.6 | 2,996.9 |
| Account Receivables, % | 47.79 | 41.73 | 40.26 | 42.88 | 42.59 | 43.05 | 43.05 | 43.05 | 43.05 | 43.05 |
| Inventories | 565.3 | 802.2 | 803.2 | 836.5 | 873.3 | 1,033.0 | 1,159.2 | 1,300.9 | 1,459.8 | 1,638.2 |
| Inventories, % | 22.46 | 24.8 | 23.32 | 24.75 | 22.33 | 23.53 | 23.53 | 23.53 | 23.53 | 23.53 |
| Accounts Payable | 716.0 | 1,128.0 | 890.5 | 946.7 | 1,152.7 | 1,287.6 | 1,445.0 | 1,621.5 | 1,819.7 | 2,042.0 |
| Accounts Payable, % | 28.45 | 34.88 | 25.85 | 28.02 | 29.47 | 29.33 | 29.33 | 29.33 | 29.33 | 29.33 |
| Capital Expenditure | -130.5 | -133.5 | -93.3 | -78.9 | -185.4 | -167.6 | -188.1 | -211.1 | -236.9 | -265.9 |
| Capital Expenditure, % | -5.19 | -4.13 | -2.71 | -2.34 | -4.74 | -3.82 | -3.82 | -3.82 | -3.82 | -3.82 |
| Tax Rate, % | 11.72 | 11.72 | 11.72 | 11.72 | 11.72 | 11.72 | 11.72 | 11.72 | 11.72 | 11.72 |
| EBITAT | 361.3 | 394.6 | 404.4 | 319.1 | 194.7 | 464.4 | 521.1 | 584.8 | 656.2 | 736.4 |
| Depreciation | ||||||||||
| Changes in Account Receivables | ||||||||||
| Changes in Inventories | ||||||||||
| Changes in Accounts Payable | ||||||||||
| Capital Expenditure | ||||||||||
| UFCF | -697.6 | 418.6 | 198.6 | 383.0 | 148.1 | 257.2 | 367.7 | 412.6 | 463.0 | 519.6 |
| WACC, % | 9.32 | 9.32 | 9.33 | 9.32 | 9.33 | 9.32 | 9.32 | 9.32 | 9.32 | 9.32 |
| PV UFCF | ||||||||||
| SUM PV UFCF | 1,515.5 | |||||||||
| Long Term Growth Rate, % | 2.00 | |||||||||
| Free cash flow (T + 1) | 530 | |||||||||
| Terminal Value | 7,236 | |||||||||
| Present Terminal Value | 4,634 | |||||||||
| Enterprise Value | 6,149 | |||||||||
| Net Debt | 164 | |||||||||
| Equity Value | 5,985 | |||||||||
| Diluted Shares Outstanding, MM | 396 | |||||||||
| Equity Value Per Share | 15.10 |
What You'll Receive
- Customizable Excel Template: A fully editable Excel-based DCF Calculator featuring pre-filled financial data for Hunan Aihua Group Co., Ltd (603989SS).
- Real Data Insights: Access to historical performance data and forward-looking projections (indicated in the highlighted cells).
- Flexible Forecasting: Adjust key assumptions such as revenue growth, EBITDA margins, and WACC as needed.
- Instant Calculations: Quickly observe how your inputs affect the valuation of Hunan Aihua Group Co., Ltd (603989SS).
- Professional Resource: Designed for use by investors, CFOs, consultants, and financial analysts.
- Intuitive Design: Organized for straightforward navigation, complete with step-by-step guidance.
Key Features
- Comprehensive Aihua Data: Pre-loaded with Hunan Aihua Group's historical financials and future projections.
- Customizable Parameters: Modify revenue growth rates, profit margins, WACC, tax rates, and capital investments as needed.
- Adaptive Valuation Model: Automatic recalculations of Net Present Value (NPV) and intrinsic value according to your specified inputs.
- Scenario Analysis: Build various forecasting scenarios to explore different valuation results.
- User-Centric Interface: Intuitive, organized design suitable for both industry experts and newcomers.
How It Works
- Download: Obtain the pre-formatted Excel file containing Hunan Aihua Group Co., Ltd's (603989SS) financial data.
- Customize: Tailor your forecasts, including revenue growth, EBITDA %, and WACC.
- Update Automatically: Enjoy real-time updates of intrinsic value and NPV calculations.
- Test Scenarios: Generate multiple projections and instantly compare the results.
- Make Decisions: Leverage the valuation outcomes to inform your investment strategy.
Why Choose This Calculator for Hunan Aihua Group Co., Ltd (603989SS)?
- Reliable Data: Utilize accurate financial information for dependable valuation outcomes.
- Customizable Options: Tailor essential variables such as growth rates, WACC, and tax rates to fit your forecasts.
- Efficiency Boost: Pre-configured calculations help you avoid starting from square one.
- Professional-Quality Tool: Perfectly crafted for investors, analysts, and consultants alike.
- User-Friendly Interface: Clear design and guided instructions ensure accessibility for all users.
Who Can Benefit from This Product?
- Finance Students: Master valuation methods and put them to practice with real-world data.
- Academics: Use established models to enhance your teaching or research initiatives.
- Investors: Validate your assumptions and examine valuation results for Hunan Aihua Group Co., Ltd (603989SS).
- Analysts: Optimize your analysis process with a tailored, ready-to-use DCF model.
- Small Business Owners: Learn how major public companies like Hunan Aihua Group Co., Ltd (603989SS) are valued and assessed.
What the Template Includes
- Comprehensive DCF Model: An editable template featuring detailed valuation calculations.
- Real-World Data: Hunan Aihua Group Co., Ltd's historical and projected financials preloaded for thorough analysis.
- Customizable Parameters: Modify WACC, growth rates, and tax assumptions to evaluate various scenarios.
- Financial Statements: Complete annual and quarterly breakdowns for enhanced insights.
- Key Ratios: Built-in metrics for assessing profitability, efficiency, and leverage.
- Dashboard with Visual Outputs: Charts and tables providing clear, actionable results.
Disclaimer
All information, articles, and product details provided on this website are for general informational and educational purposes only. We do not claim any ownership over, nor do we intend to infringe upon, any trademarks, copyrights, logos, brand names, or other intellectual property mentioned or depicted on this site. Such intellectual property remains the property of its respective owners, and any references here are made solely for identification or informational purposes, without implying any affiliation, endorsement, or partnership.
We make no representations or warranties, express or implied, regarding the accuracy, completeness, or suitability of any content or products presented. Nothing on this website should be construed as legal, tax, investment, financial, medical, or other professional advice. In addition, no part of this site—including articles or product references—constitutes a solicitation, recommendation, endorsement, advertisement, or offer to buy or sell any securities, franchises, or other financial instruments, particularly in jurisdictions where such activity would be unlawful.
All content is of a general nature and may not address the specific circumstances of any individual or entity. It is not a substitute for professional advice or services. Any actions you take based on the information provided here are strictly at your own risk. You accept full responsibility for any decisions or outcomes arising from your use of this website and agree to release us from any liability in connection with your use of, or reliance upon, the content or products found herein.